
|
|
Seismicity Animations, Fault Rupture Model, etc. of the Great 2011 Tohoku-oki Earthquake Sequence |
|
The animation shows the epicenters of earthquakes in the Seismicity of the Great 2011 Tohoku Earthquake sequence. The epicentral data are from the US Geological Survey (The National Earthquake Information Center; earthquake.usgs.gov) are preliminary estimates of the event locations. The symbol sizes may not match the aftershock animation. The depth is encoded in the colors: red < 33; orange < 101; yellow < 201; green < 301; blue deeper than 301. Credit: Animation by C. J. Ammon, Penn State, data from the US Geological Survey. |
|
Each animation frame is one-hour step, so time move fast when the animation runs. The symbols fade away after one week. Orange symbols indicate events with larger estimated depths. The best way to examine the sequence is to step through the animation using the arrow keys to control the rate. If you want a copy and don't have QuickTime Pro to download the source, try using "Download Linked File" on this link. The sequence begins just after midnight (UTC) on 09 March, the Mw 9.0 mainshock occurs early on 11 March. Japan is nine hours ahead of UTC. The blue curves are ocean-depth contours. The gray curves are elevation contours. The thick gray line is the coastline. The rate of seismicity is high and locating all the aftershocks that are occurring is a challenge, so some events may not be in the data set yet. Also, the NEIC focuses on the moderate and large magnitude events, so the thousands of small-magnitude events that have no doubt occurred are not included. |
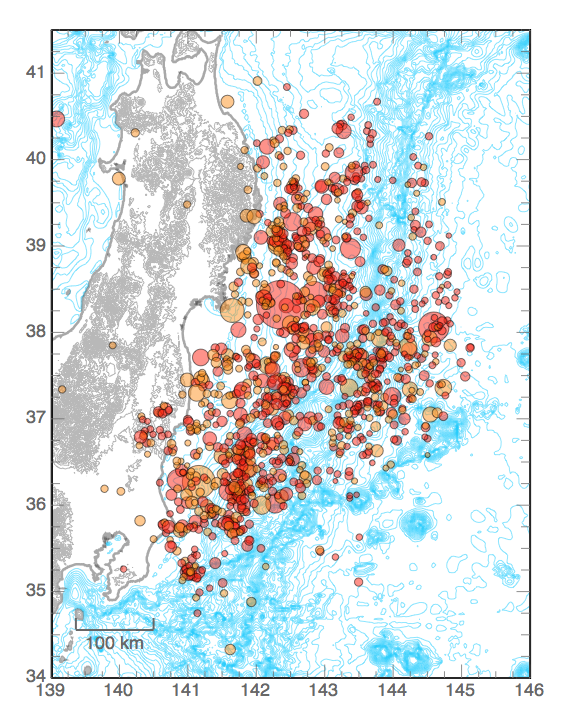
A summary plot of the events located by the USGS as of Thursday 07 April, morning (US Eastern Time). Credit: Image by C. J. Ammon, Penn State, data from the US Geological Survey. |
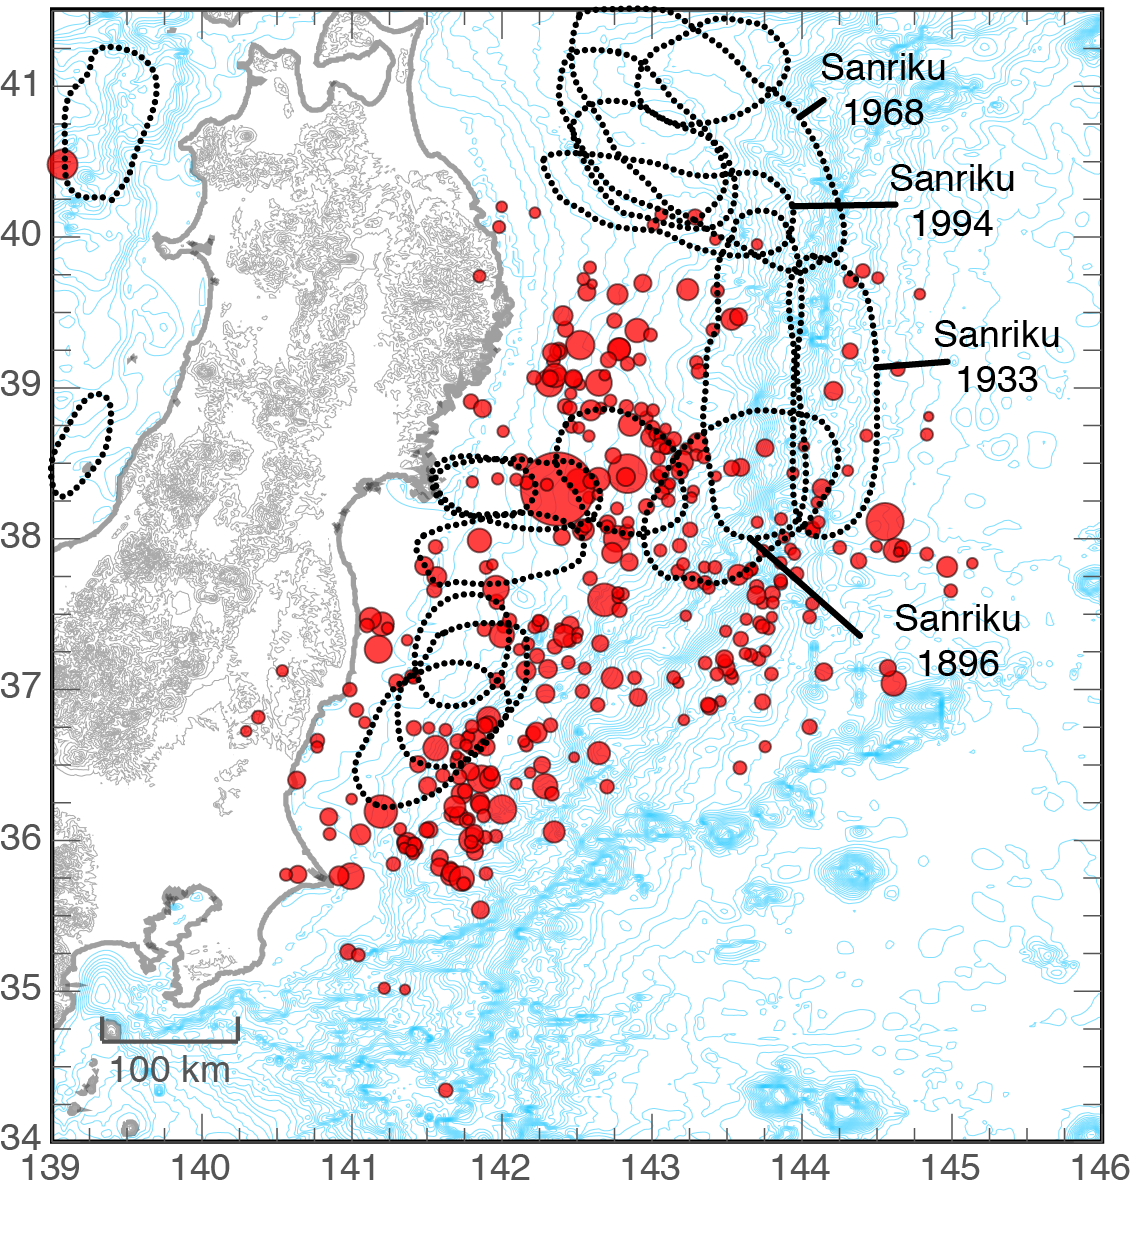
A summary plot of the events located by the USGS as of Sunday morning (US Eastern Time). Estimates of historic rupture areas are also shown; Credit: Image by C. J. Ammon, Penn State, rupture outlines from Hiroo Kanamori, Caltech, data from the US Geological Survey. |
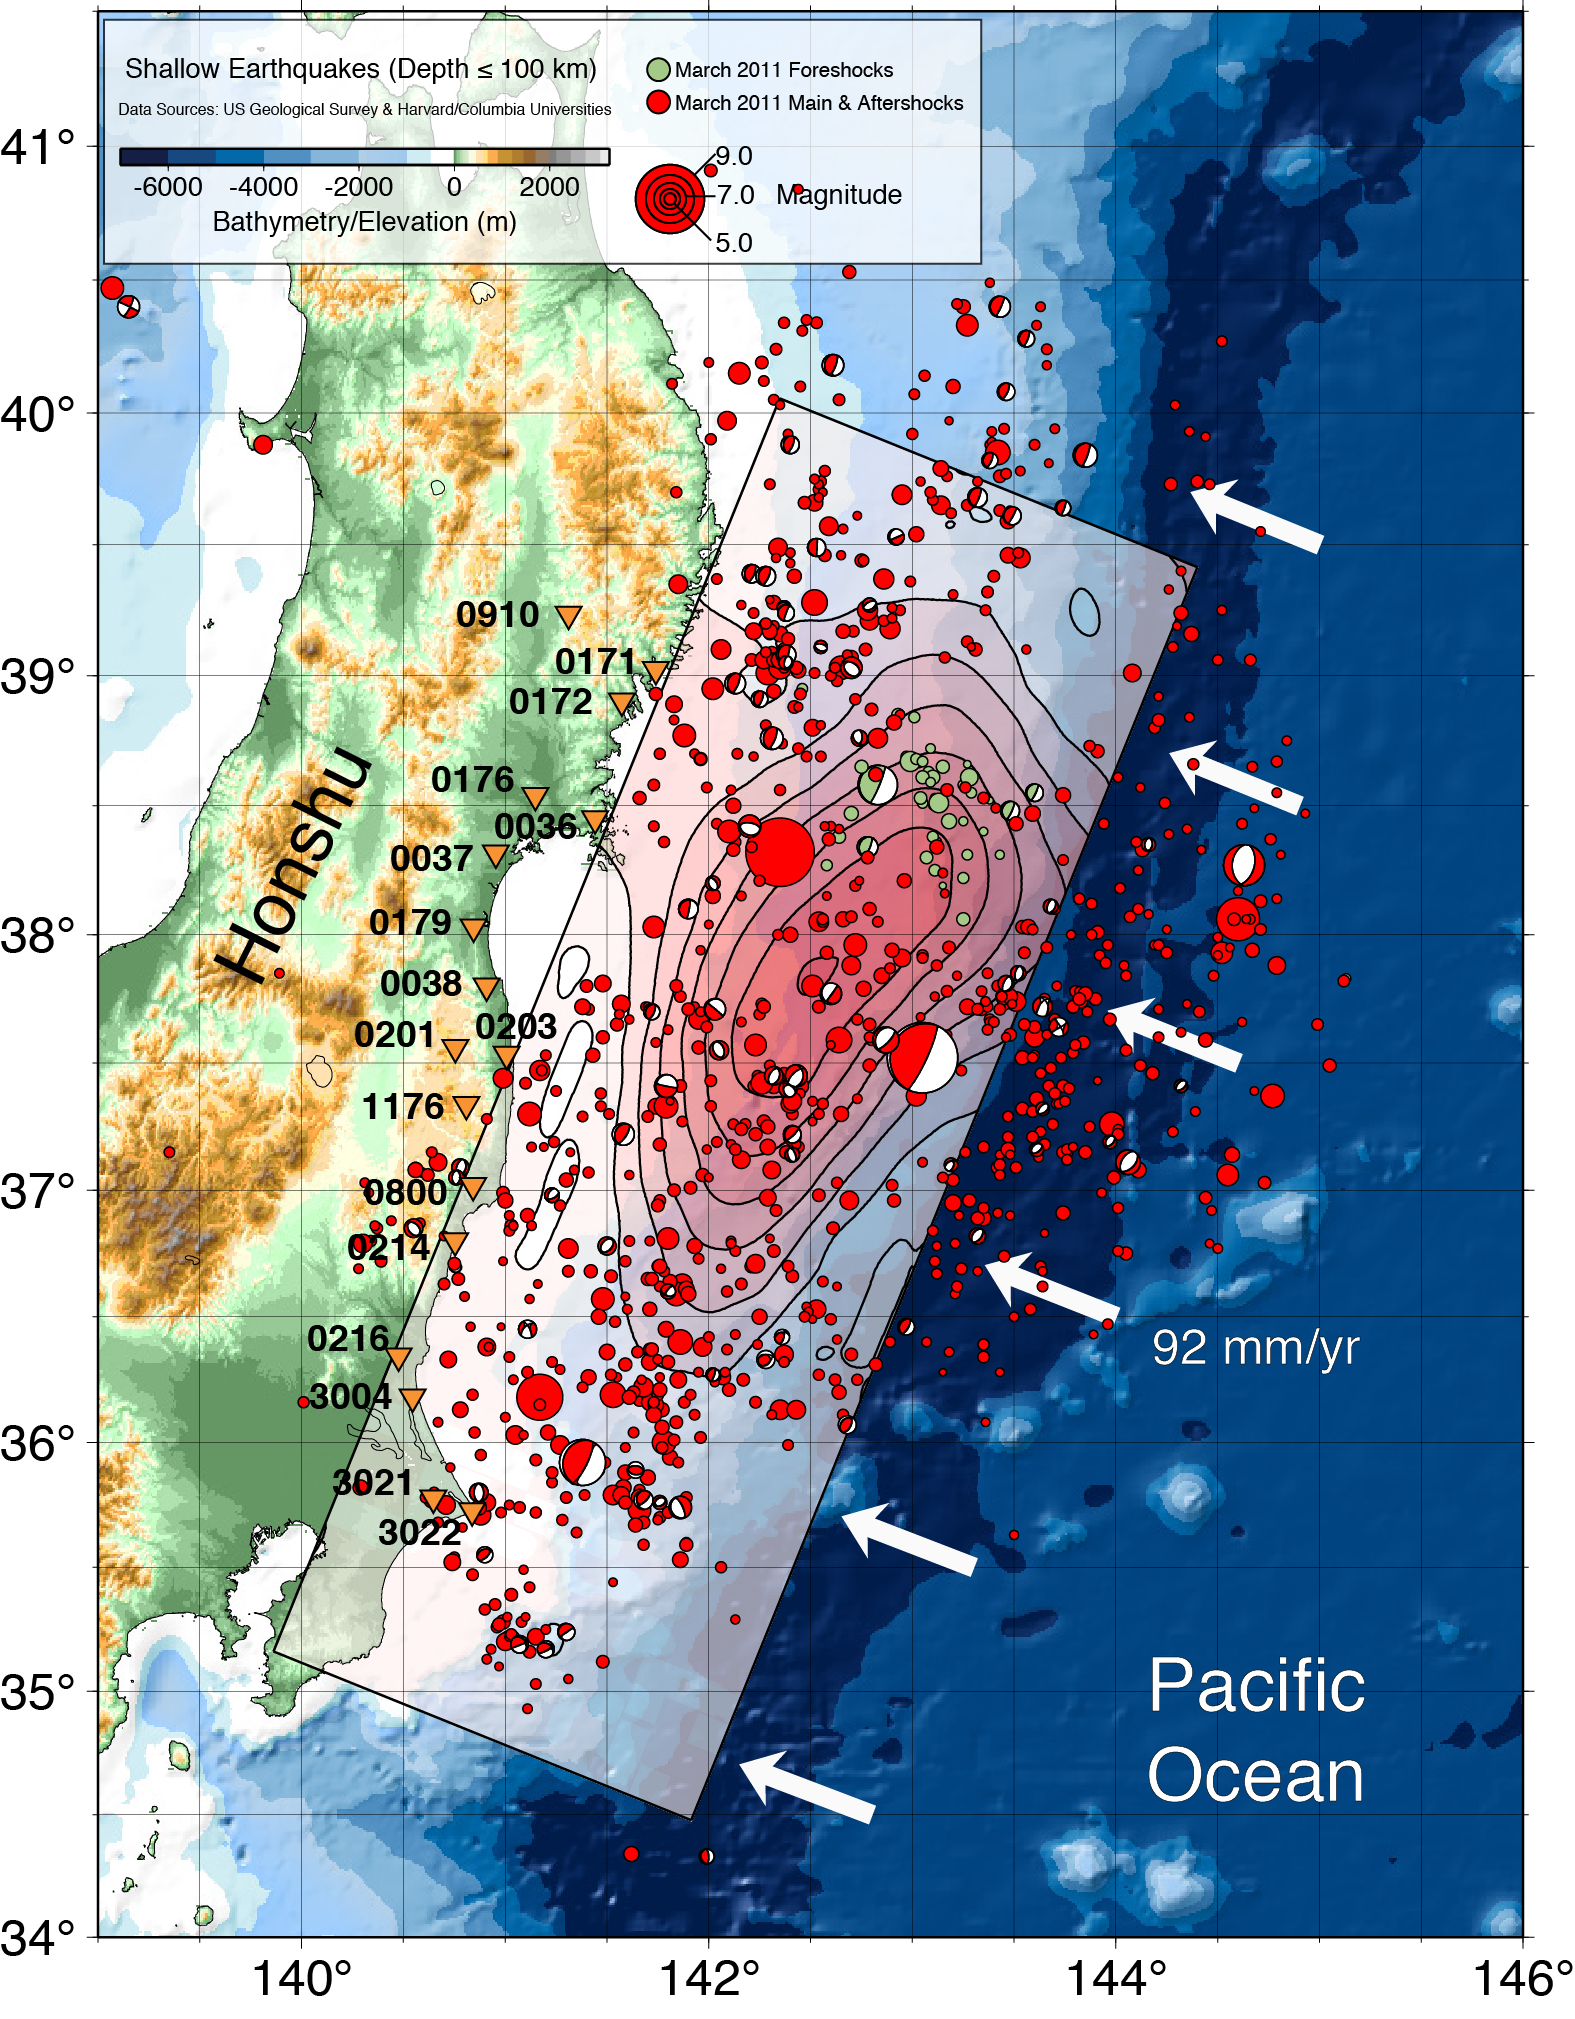
A comparison of an estimate of coseismic slip (created in collaboration with Thorne Lay at UC Santa Cruz and Hiroo Kanamori at CalTech) with the aftershocks and bathymetry. You can read about the model at the link to preprint of the Earth, Planets, Space manuscript. Some details: The slip was estimated using distantly recorded P waveforms and Relative Source Time Functions estimated from Rayleigh wave signals using the Mw 7.5 foreshock as an empirical Green function and from high-sample rate (continuous) GPS observations. Click here to see the model. Click here to see inversion summary. Credit: Rupture model by C. J. Ammon and Mike Cleveland Penn State, T. Lay, UC Santa Cruz, and H. Kanamori, Caltech. Aftershock data from the US Geological Survey. |
Seismicity of Northern Japan (1973-April 2011). |
|
Updated on 8 April, 2011. The symbol sizes may not match the aftershock animation. The depth is encoded in the colors: red < 33; orange < 101; yellow < 201; green < 301; blue deeper than 301. I will update when I get some time. Credit: Animation by C. J. Ammon, Penn State, data from the US Geological Survey. If you want a copy and do not have QuickTime Pro to download the source, try using "Download Linked File" on this link (43 mBytes). |
Sample of Geodetic Observations from Japan |
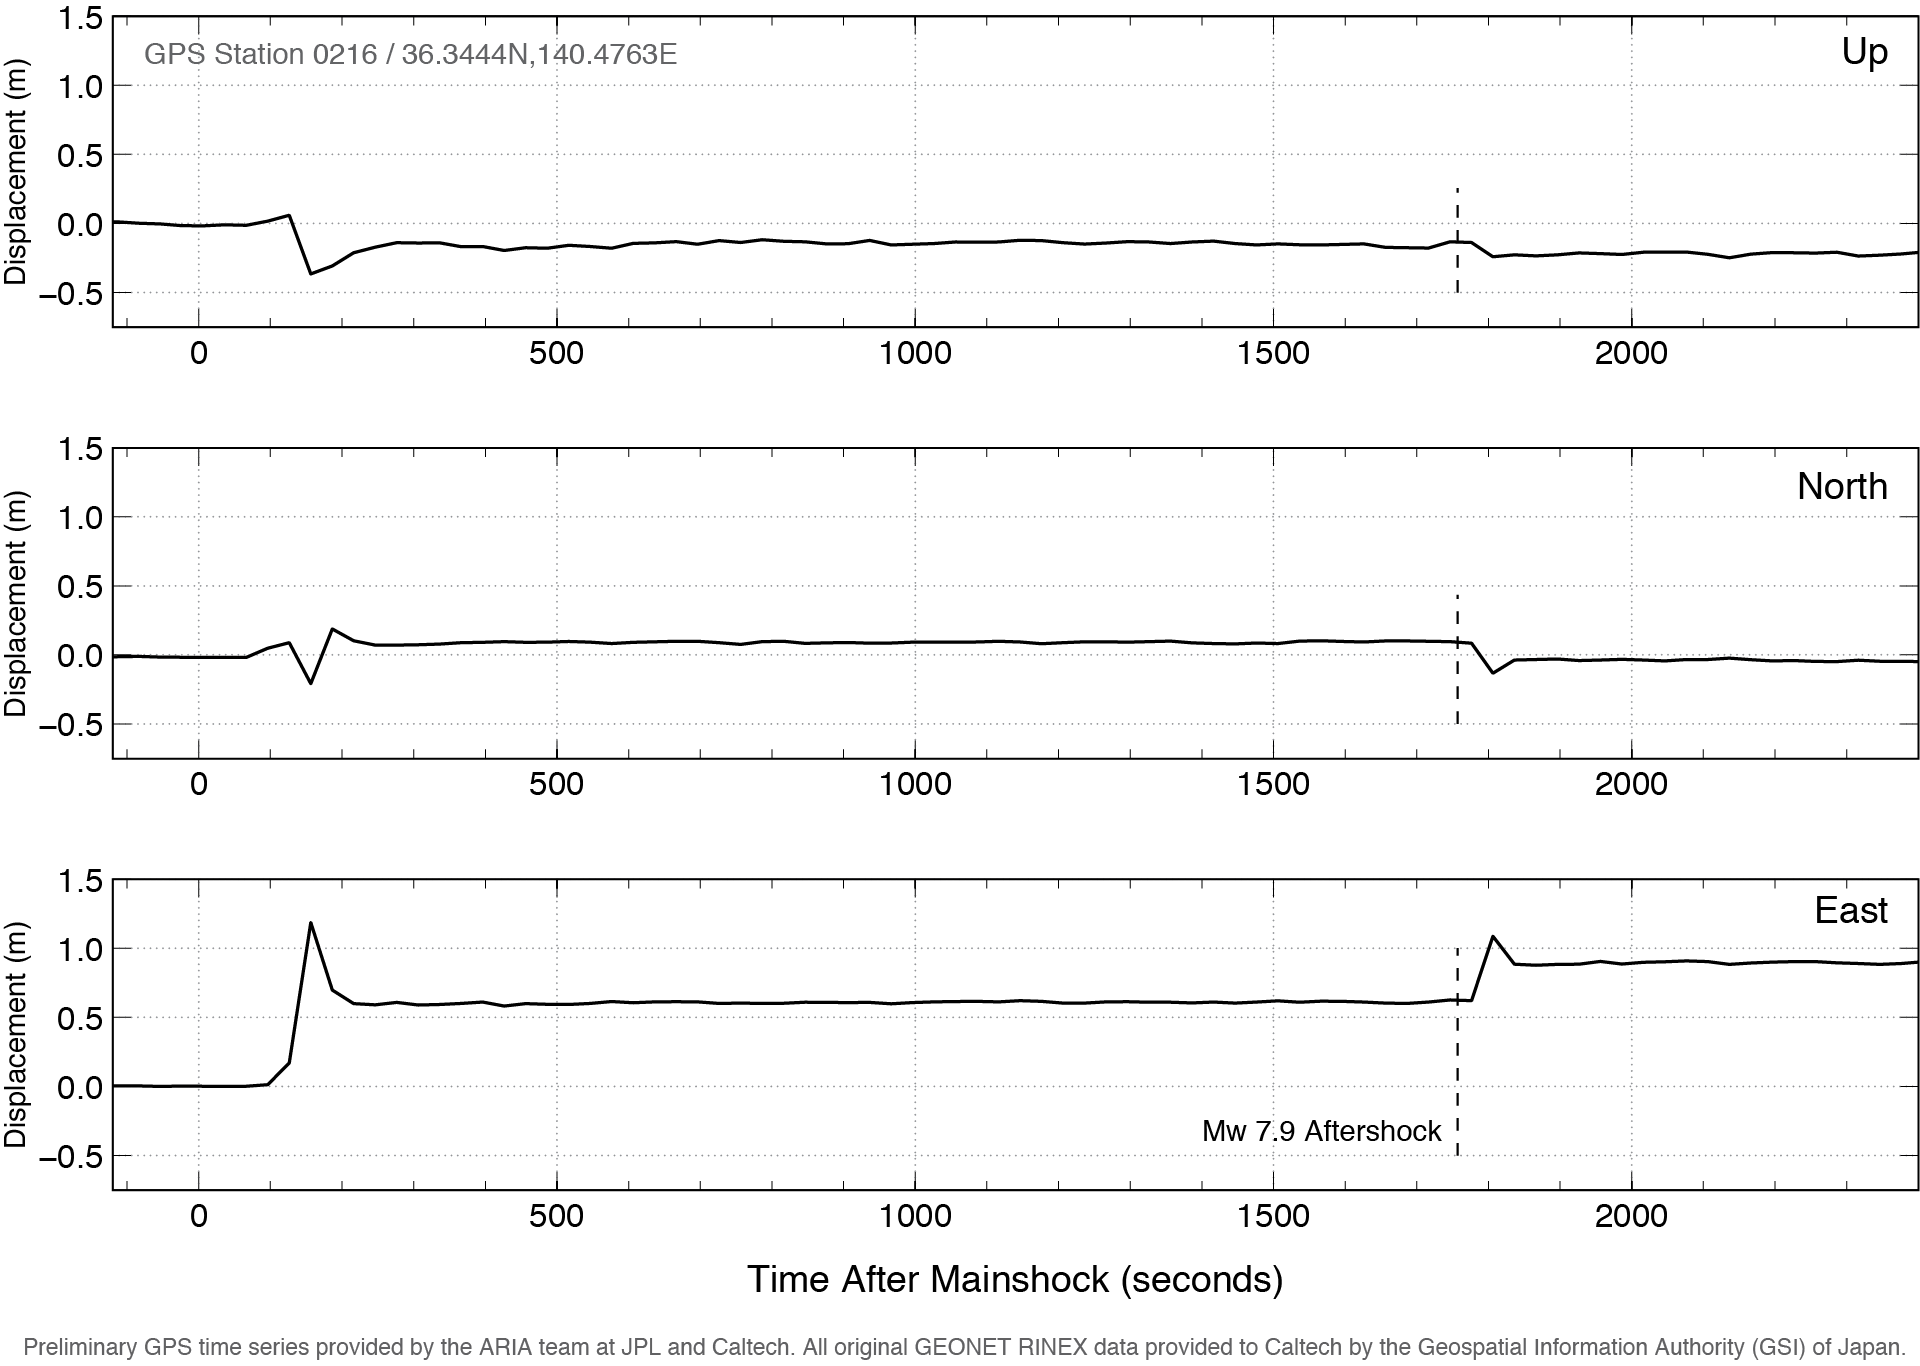
Very nice GPS data from Japan. The data show large eastward offsets produced by the mainshock (which occurred at time zero) and a large, early aftershock (Mw 7.9) that occurred just under 30 minutes later. Credit: Preliminary GPS time series provided by the ARIA team at JPL and Caltech. All original GEONET RINEX data provided to Caltech by the Geospatial Information Authority (GSI) of Japan. Chart by C. J. Ammon, Penn State. 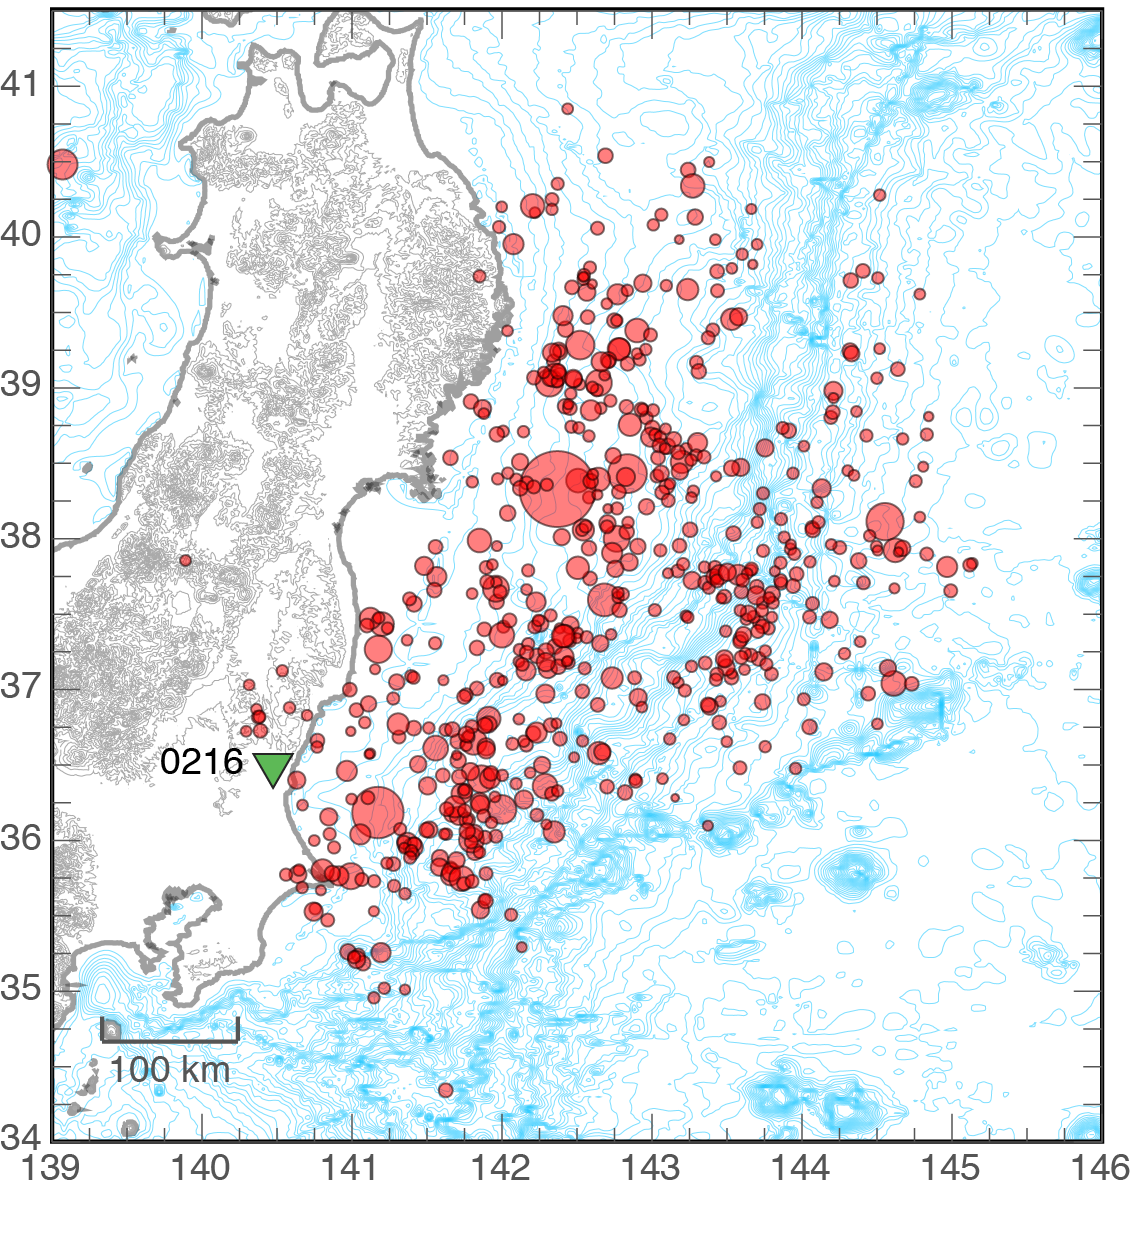
Location of GPS station 0216 and the recent aftershocks. The Mw 9.0 mainshock caused sliding along much of the area covered by aftershocks. The large aftershock 30 minutes later is located close to the GPS observing station. |
| Charles J. Ammon, Professor of Geosciences Department of Geosciences 440 Deike Bldg. University Park, PA 16802 |
E-Mail: charlesammon@psu.edu
|