SLU
EAS-A193 Class Notes
|
SLU EAS-A193 Class Notes |
|
When you look at a seismogram the wiggles you see are an indication that the ground is being, or was, vibrated by seismic waves. Seismic waves are propagating vibrations that carry energy from the source of the shaking outward in all directions. You can picture this concept by recalling the circular waves that spread over the surface of a pond when a stone is thrown into the water. An earthquake is a more complicated process than a stone splashing into water, and the seismic waves that are set up during an earthquake are more varied than those on the pond.
The are many different seismic waves, but all of basically of four types:
An earthquake radiates P and S waves in all directions and the interaction of the P and S waves with Earth's surface and shallow structure produces surface waves.
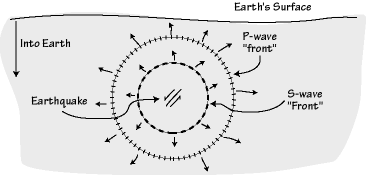
Near an earthquake the shaking is large and dominated by shear-waves and short-period surface waves. These are the waves that do the most damage to our buildings, highways, etc. Even in large earthquakes the intense shaking generally lasts only a few tens of seconds, but it can last for minutes in the greatest earthquakes. At farther distances the amplitude of the seismic waves decreases as the energy released by the earthquake spreads throughout a larger volume of Earth. Also with increasing distance from the earthquake, the waves are separated apart in time and dispersed because P, S, and surface waves travel at different speeds.
|
Seismic waves can be distinguished by a number of properties including the speed the waves travel, the direction that the waves move particles as they pass by, where and where they don't propagate. We'll go through each wave type individually to expound upon the differences. The first two wave types, P and S , are called body waves because they travel or propagate through the body of Earth. The latter two are called surface waves they the travel along Earth's surface and their amplitude decreases with depth into Earth. |
|
Travel times are best conceptualized of with an analogy of an auto trip. If you have to travel 120 miles and you drive 60 mph, you'll get to your destination in two hours, if you are forced to drive at a speed of 30 mph, it will take you twice as long to arrive at your destination. The mathematical formula we use in this problem is
To apply those ideas to earthquake studies, think of the earthquake location as the starting point for the trip and the seismometer as the place where the trip concludes. Faster waves will travel the distance quicker and show up on the seismogram first.
Travel time is a relative time, it is the number of minutes, seconds, etc. that the wave took to complete its journey. The arrival time is the time when we record the arrival of a wave - it is an absolute time, usually referenced to Universal Coordinated Time (a 24-hour time system used in many sciences). Here's an example to illustrate the difference: if two earthquakes occurred at the same place but exactly 24 hours apart, the wave travel times would be the same but the arrival times would differ by one day.
Seismic waves travel fast, on the order of kilometers per second (km/s). The precise speed that a seismic wave travels depends on several factors, most important is the composition of the rock. We are fortunate that the speed depends on the rock type because it allows us to use observations recorded on seismograms to infer the composition or range of compositions of the planet. But the process isn't always simple, because sometimes different rock types have the same seismic-wave velocity, and other factors also affect the speed, particularly temperature and pressure. Temperature tends to lower the speed of seismic waves and pressure tends to increase the speed. Pressure increases with depth in Earth because the weight of the rocks above gets larger with increasing depth. Usually, the effect of pressure is the larger and in regions of uniform composition, the velocity generally increases with depth, despite the fact that the increase of temperature with depth works to lower the wave velocity.
When I describe the different seismic wave types below I'll quote ranges of speed to indicate the range of values we observe in common terrestrial rocks. But you should keep in mind that the specific speed throughout Earth will depend on composition, temperature, and pressure.
P-waves are the first waves to arrive on a complete record of ground shaking because they travel the fastest (their name derives from this fact - P is an abbreviation for primary, first wave to arrive). They typically travel at speeds between ~1 and ~14 km/sec. The slower values corresponds to a P-wave traveling in water, the higher number represents the P-wave speed near the base of Earth's mantle.
The velocity of a wave depends on the elastic properties and density of a material. If we let k represent the bulk modulus of a material, m the shear-modulus, and r the density, then the P-wave velocity, which we represent by a, is defined by:
A modulus is a measure of how easy or difficulty it is to deforms a material. For example, the bulk modulus is a measure of how a material changes volume when pressure is applied and is a characteristic of a material. For example, foam rubber has a lower bulk modulus than steel.
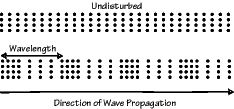
P-waves are sound waves, it's just that in seismology we are interested in frequencies that are lower than humans' range of hearing (the speed of sound in air is about 0.3 km/sec). The vibration caused by P waves is a volume change, alternating from compression to expansion in the direction that the wave is traveling. P-waves travel through all types of media - solid, liquid, or gas.
 |
|
As a P-wave passes the ground is vibrated in the direction that the wave is propagating. |
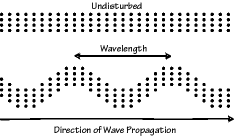
Secondary , or S waves, travel slower than P waves and are also called "shear" waves because they don't change the volume of the material through which they propagate, they shear it. S-waves are transverse waves because they vibrate the ground in a the direction "transverse", or perpendicular, to the direction that the wave is traveling.
 |
|
As a transverse wave passes the ground perpendicular to the direction that the wave is propagating. S-waves are transverse waves. |
The S-wave speed, call it b, depends on the shear modulus and the density
Even though they are slower than P-waves, the S-waves move quickly. Typical S-wave propagation speeds are on the order of 1 to 8 km/sec. The lower value corresponds to the wave speed in loose, unconsolidated sediment, the higher value is near the base of Earth's mantle.
An important distinguishing characteristic of an S-wave is its inability to propagate through a fluid or a gas because a fluids and gasses cannot transmit a shear stress and S-waves are waves that shear the material.
In general, earthquakes generate larger shear waves than compressional waves and much of the damage close to an earthquake is the result of strong shaking caused by shear waves.
We can use the fact that P and S waves travel at different speeds to locate earthquakes. Assume a seismometer are is far enough from the earthquake that the waves travel roughly horizontally, which is about 50 to 500 km for shallow earthquakes. When an earthquake occurs the P and S waves travel outward from the region of the fault that ruptured and the P waves arrive at the seismometer first, followed by the S-wave. Once the S-wave arrives we can measure the time interval between the onset of P-wave and the onset of S-wave shaking.
The travel time of the P wave is
The travel time of the S wave is
The difference in the arrival times of the waves is
which equals
We can measure that difference from a seismogram and if we also know the speed that the waves travel, we could calculate the distance by equating the measured time difference and the expression. For the distance range 50 to 500 km, the S-waves travel about 3.45 km/s and the P-waves around 8 km/s. The value in parentheses is then equal to about (1/3.45 - 1/8) or about 1/8. Thus the simple rule of thumb for earthquakes in this distance range is the distance is about eight times the arrival time of S-wave less the arrival time of the P-wave.
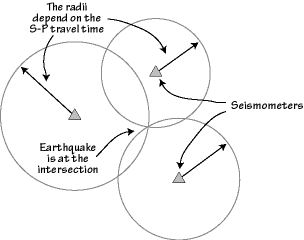
That means that we can estimate the distance an earthquake is from a seismometer. The earthquake can be in any direction, but must be the estimated distance away. Geometrically that means that the earthquake must be located on a circle surrounding the seismometer, and the radius of the circle is about eight times the observed wave travel-time difference (in kilometers).
If we have two other seismometers which recorded the same earthquake, we could make a similar measurement and construct a circle of possible locations for each seismometer. Since the earthquake location since it must lie on each circle centered on a seismometer, if we plot three or more circles on a map we could find that the three circles will intersect at a single location - the earthquake's epicenter.
 |
|
Using the "S minus P arrival time" to locate an earthquake. You need at least three stations and some idea of the P and S velocities between the earthquake and the seismometers. |
In practice we use better estimates of the speed than our simple rule of thumb and solve the problem using algebra instead of geometry. We also can include the earthquake depth and the time that earthquake rupture initiated (called the "origin time") into the problem.
Love waves are transverse waves that vibrate the ground in the horizontal direction perpendicular to the direction that the waves are traveling. They are formed by the interaction of S waves with Earth's surface and shallow structure and are dispersive waves. The speed at which a dispersive wave travels depends on the wave's period. In general, earthquakes generate Love waves over a range of periods from 1000 to a fraction of a second, and each period travels at a different velocity but the typical range of velocities is between 2 and 6 km/second.
 |
|
Love waves are transverse and restricted to horizontal movement - they are recorded only on seismometers that measure the horizontal ground motion. |
Another important characteristic of Love waves is that the amplitude of ground vibration caused by a Love wave decreases with depth - they're surface waves. Like the velocity the rate of amplitude decrease with depth also depends on the period.
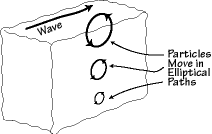
Rayleigh waves are the slowest of all the seismic wave types and in some ways the most complicated. Like Love waves they are dispersive so the particular speed at which they travel depends on the wave period and the near-surface geologic structure, and they also decrease in amplitude with depth. Typical speeds for Rayleigh waves are on the order of 1 to 5 km/s.
 |
|
Rayleigh waves are similar to water waves in the ocean (before they "break" at the surf line). As a Rayleigh wave passes, a particle moves in an elliptical trajectory that is counterclockwise (if the wave is traveling to your right). The amplitude of Rayleigh-wave shaking decreases with depth. |
As you might expect, the difference in wave speed has a profound influence on the nature of seismograms. Since the travel time of a wave is equal to the distance the wave has traveled, divided by the average speed the wave moved during the transit, we expect that the fastest waves arrive at a seismometer first. Thus, if we look at a seismogram, we expect to see the first wave to arrive to be a P-wave (the fastest), then the S-wave, and finally, the Love and Rayleigh (the slowest) waves. Although we have neglected differences in the travel path (which correspond to differences in travel distance) and the abundance waves that reverberate within Earth, the overall character is as we have described.
The fact that the waves travel at speeds which depend on the material properties (elastic moduli and density) allows us to use seismic wave observations to investigate the interior structure of the planet. We can look at the travel times, or the travel times and the amplitudes of waves to infer the existence of features within the planet, and this is a active area of seismological research. To understand how we "see" into Earth using vibrations, we must study how waves interact with the rocks that make up Earth.
Several types of interaction between waves and the subsurface geology (i.e. the rocks) are commonly observable on seismograms
We'll examine the two simplest types of interaction refraction and reflection.
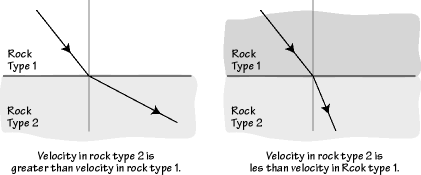
As a wave travels through Earth, the path it takes depends on the velocity. Perhaps you recall from high school a principle called Snell's law, which is the mathematical expression that allows us to determine the path a wave takes as it is transmitted from one rock layer into another. The change in direction depends on the ratio of the wave velocities of the two different rocks.
 |
|
When waves reach a boundary between different rock types, part of the energy is transmitted across the boundary. The transmitted wave travels in a different direction which depends on the ratio of velocities of the two rock types. Part of the energy is also reflected backwards into the region with Rock Type 1, but I haven't shown that on this diagram. |
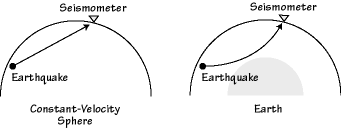
Refraction has an important affect on waves that travel through Earth. In general, the seismic velocity in Earth increases with depth (there are some important exceptions to this trend) and refraction of waves causes the path followed by body waves to curve upward.
 |
|
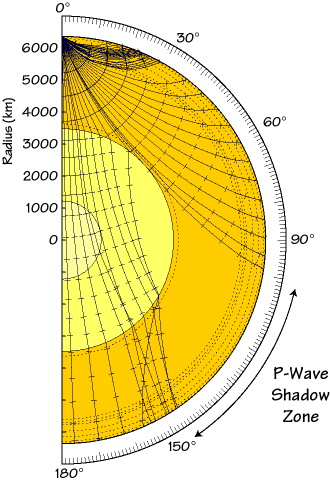
The overall increase in seismic wave speed with depth into Earth produces an upward curvature to rays that pass through the mantle. A notable exception is caused by the decrease in velocity from the mantle to the core. This speed decrease bends waves backwards and creates a "P-wave Shadow Zone" between about 100° and 140° distance (1° = 111.19 km). |
The second wave interaction with variations in rock type is reflection. I am sure that you are familiar with reflected sound waves; we call them echoes. And your reflection in a mirror or pool of water is composed of reflected light waves. In seismology, reflections are used to prospect for petroleum and investigate Earth's internal structure. In some instances reflections from the boundary between the mantle and crust may induce strong shaking that causes damage about 100 km from an earthquake (we call that boundary the "Moho" in honor of Mohorovicic, the scientist who discovered it).
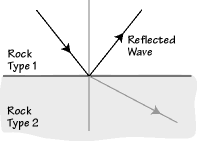
A seismic reflection occurs when a wave impinges on a change in rock type (which usually is accompanied by a change in seismic wave speed). Part of the energy carried by the incident wave is transmitted through the material (that's the refracted wave described above) and part is reflected back into the medium that contained the incident wave.
 |
|
When a wave encounters a change in material properties (seismic velocities and or density) its energy is split into reflected and refracted waves. |
The amplitude of the reflection depends strongly on the angle that the incidence wave makes with the boundary and the contrast in material properties across the boundary. For some angles all the energy can be returned into the medium containing the incident wave.
The actual interaction between a seismic wave and a contrast in rock properties is more complicated because an incident P wave generates transmitted and reflected P- and S-waves and so five waves are involved. Likewise, when an S-wave interacts with a boundary in rock properties, it too generates reflected and refracted P- and S-waves.
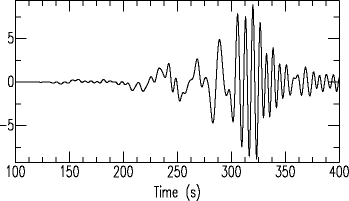
I mentioned above that surface waves are dispersive - which means that different periods travel at different velocities. The effects of dispersion become more noticeable with increasing distance because the longer travel distance spreads the energy out (it disperses the energy). Usually, the long periods arrive first since they are sensitive to the speeds deeper in Earth, and the deeper regions are generally faster.
 |
|
A dispersed Rayleigh wave generated by an earthquake in Alabama near the Gulf coast, and recorded in Missouri. |
The mathematics behind wave propagation is elegant and relatively simple, considering the fact that similar mathematical tools are useful for studying light, sound, and seismic waves. We can solve these equations or an appropriate approximation to them to compute the paths that seismic waves follow in Earth. The diagram below is an example of the paths P-waves generated by an earthquake near Earth's surface would follow.
 |
|
The paths of P-wave energy for a shallow earthquake located at the top of the diagram. The main chemical shells of Earth are shown by different colors and regions with relatively abrupt velocity changes are shown by dashed lines. The curves show the paths of waves, and the lines crossing the rays show mark the wavefront at one minute intervals. |
Note the curvature of the rays in the mantle, the complexities in the upper mantle, and the dramatic impact of the core on the wavefronts. The decrease in velocity from the lower mantle to the outer core casts a "shadow" on the P-waves that extends from about 100° to 140° distance. Other waves such as surface waves and body waves reflecting off the surface are recorded in the "shadow" region, but the P-wave "dies out" near 100°. Since the outer core is fluid, and S-waves cannot travel through a fluid, the "S-wave shadow zone" is even larger, extending from about 100° to 180°.
We have already discussed the main elements in Earth's interior, the core, the mantle, and the crust. By studying the propagation characteristics (travel times, reflection amplitudes, dispersion characteristics, etc.) of seismic waves for the last 90 years we have learned much about the detailed nature of Earth's interior. Great progress was made quickly because for the most part Earth's interior is relatively simple, divided into a sphere (the inner core) surrounded by roughly uniform shells of iron and rock. Models that assume the Earth is perfectly symmetric can be used to predict travel times of P-waves that are accurate to a few seconds for a trip all the way across the planet.
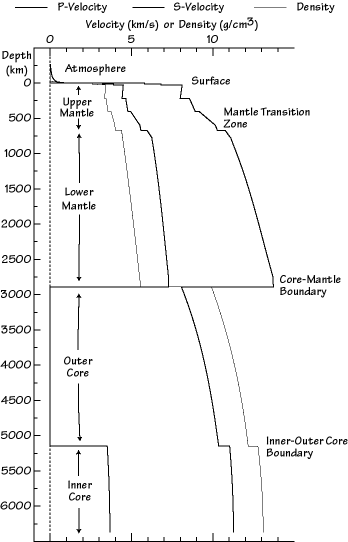
The diagram below is a plot of the P- and S-wave velocities and the density as a function of depth into Earth. The top of the Earth is located at 0 km depth, the center of the planet is at 6371 km.
 |
|
Velocity and density variations within Earth based on seismic observations. The main regions of Earth and important boundaries are labeled. This model was developed in the early 1980's and is called PREM for Preliminary Earth Reference Model. |
Several important characteristics of Earth's structure are illustrated in the chart. First note that in several large regions such as in the lower mantle, the outer core, and inner core, the velocity smoothly increases with depth. The increase is a result of the effects of pressure on the seismic wave speed. Although temperature also increases with depth, the pressure increase resulting from the weight of the rocks above has a greater impact and the speed increases smoothly in these regions of uniform composition.
The shallow part of the mantle is different; it contains several important well-established and relatively abrupt velocity changes. In fact, we often divide the mantle into two regions, upper and lower, based on the level of velocity heterogeneity. The region from near 400 to 1000 km depth is called the transition zone and strongly affects body waves that "turn" at this depth and arrive about 20°-30° distant from a shallow earthquake. In this depth range the minerals that make up the mantle silicate rocks are transformed by the increasing pressure. The atoms in these rocks rearrange themselves into compact structures that are stable at the high pressures and the result of the rearrangement is an increase in density and elastic moduli, producing an overall increase in wave speed.
Graphite in "lead" pencils and diamonds are a more common example of atoms rearranging themselves under different conditions - they are both composed of carbon. The different arrangement and bonding of the carbon atoms in the two materials produces dramatically different properties. Diamonds are formed under enormous pressures; all natural diamonds formed at depths of about 150-200 km, and were brought to the surface by volcanic activity. At the high pressures the carbon atoms are squeezed into a tight arrangement that makes them one of the hardest materials. In contrast, the low-pressure arrangement of carbon in graphite creates the slippery, soft character of "lead" that we use for pencils.
The two largest contrasts in material properties in the Earth system are located near the surface and the core-mantle boundary. Both are compositional boundaries and the core-mantle boundary is the larger contrast. Other sharp contrasts are observable, the inner-core outer-core boundary is relatively sharp, and velocities increase from the liquid to the solid.
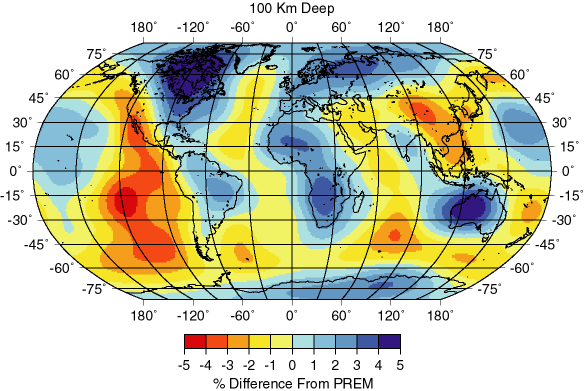
The PREM model is a useful reference for understanding the main features of Earth. More recent efforts have focused on estimating the lateral variations in wave speed within the shells that make up the reference model. These approaches are often based on seismic tomography, which is a way of mapping out the variations in structure using observations from large numbers of seismograms. The basic idea is to use observed delayed (or early) arrival times (delayed with respect to the reference model) to locate regions of relatively fast and relatively slow seismic wave speed.
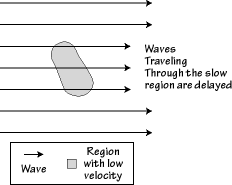 |
The idea is illustrated in the cartoon to the left. Waves are represented by arrows and are traveling from left to right. Those that travel through the slow region are slowed down, and hence will be recorded later on the a seismogram. The same ideas are used in medical CAT scan imaging of human bodies, but the observed quantity in a CAT scan is not a travel time, but the amount of x-ray absorption. Ultrasound imaging is identical to P-wave tomography, it's just that in seismology we don't have the choice of where are wave sources are located - we just exploit earthquakes. |
In the two decades tomography has been applied to Earth studies on many scales, from looking at small regions of Earth's crust that may contain petroleum, to imaging the entire planet. On a global scale, we might expect that the shallow parts of the mantle would correlate with the major structural features we can observe at the surface - the plate boundaries.
In regions where material is rising from the mantle, it should be warmer, and the velocity should be lower, in regions that are old and cold, such as beneath many of the old parts of continents, we would expect to see faster regions (assuming that temperature is the only difference). The actual variations are influenced by both temperature and composition variations, but they agree well with the ideas of plate tectonics, particularly at the divergent boundaries or oceanic spreading ridges.
 |
|
Map of the variations in seismic shear-wave speed with respect to the value in PREM at 100 km depth. The warm colors (red, orange, and yellow) show regions with slower than normal speeds, the darker regions are faster than normal. Note the correlation with plate boundaries and surface heat flow. (Model S12 WM13, from W.-J. Su, R. L. Woodward and A. M. Dziewonski, Degree-12 Model of Shear Velocity Heterogeneity in the Mantle, Journal of Geophysical Research, vol. 99(4) 4945-4980, 1994). |
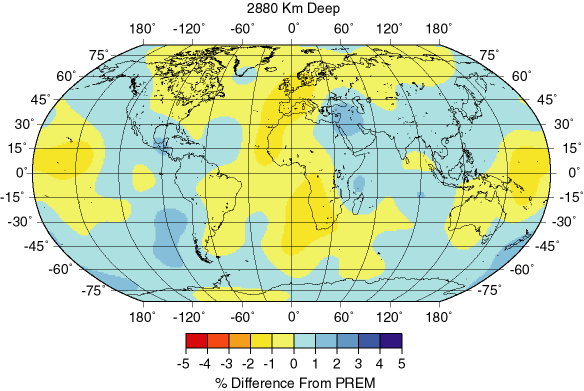
The velocities deeper in the Earth have also be imaged. The next map shows the variations at 2,880 km depth , in the mantle just above the core-mantle boundary. The color scale is the same but note how the lower-mantle velocity variations are more subdued than those in the more heterogeneous upper mantle. Also, note that the correlation with surface tectonics is gone, as you would expect for a complex convective system such as Earth's mantle.
 |
|
Map of the variations in seismic shear-wave speed with respect to the value in PREM at 2,880 km depth, just above the core mantle boundary. The warm colors (red, orange, and yellow) show regions with slower than normal speeds, the darker regions are faster than normal. Note the correlation with plate boundaries and surface heat flow. (Model S12 WM13, from W.-J. Su, R. L. Woodward and A. M. Dziewonski, Degree-12 Model of Shear Velocity Heterogeneity in the Mantle, Journal of Geophysical Research, vol. 99(4) 4945-4980, 1994). |
These variations are actually quite small, on the order of a few percent, so the basic idea of Earth being a spherically stratified planet are well founded. In the crust, the variations are larger and can reach tens of percent. The crust is the material extracted from the mantle over the last 4.5 billion years and it contains a great diversity of structures that are often apparent when you study the rocks exposed at the surface.