
Although relatively rare, large intraplate earthquakes provide important information for the analysis of the transmittal of stresses within the interior of plates. Thus, delineation of the structure in regions known to produce large intraplate earthquakes is particularly important for understanding the state of stress and the causes of the spatial concentration of stress release within the interior of lithospheric plates. More importantly, intraplate earthquakes pose a significant hazard to society's infrastructure since earthquake resistant design requirements were nonexistent throughout much of the development of the heavily populated eastern United States. The New Madrid Region of the central United States is a region with a history for large intraplate earthquakes. Unraveling the structure of the New Madrid region requires the synthesis of all available geoscience data, and high-resolution seismic imaging clearly plays an important role in this effort.
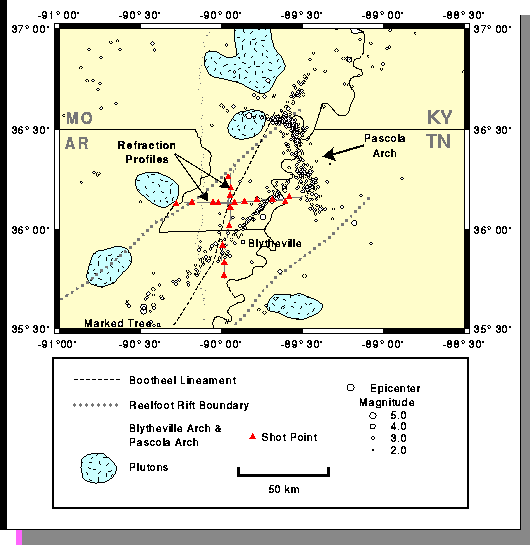
The New Madrid Seismic Zone (NMSZ) is located in the central United States within the borders of Arkansas, Illinois, Kentucky, Missouri, and Tennessee. In 1811-1812, the region experienced three large earthquakes, each with body-wave magnitudes estimated at approximately 7.1-7.3 (Nuttli, BSSA, 1973). At present, the NMSZ is the most seismically active region in the eastern United States and the potential for occurrence of a large earthquake such as in the early 1800's presents a significant seismic hazard to the large population centers located nearby. The NMSZ, located near the "bootheel" of Missouri, is readily identified in the map of epicenters for the central US (Figure 1). The epicenters do not correlate with any first-order features in the topography, and are mostly constrained to the geologic basement, beneath these near-surface features. In the last several decades, geoscientists have concentrated efforts on understanding the tectonics structures and processes operating throughout the region. However, the limited expression of faulting processes in the surface structures complicated the effort.
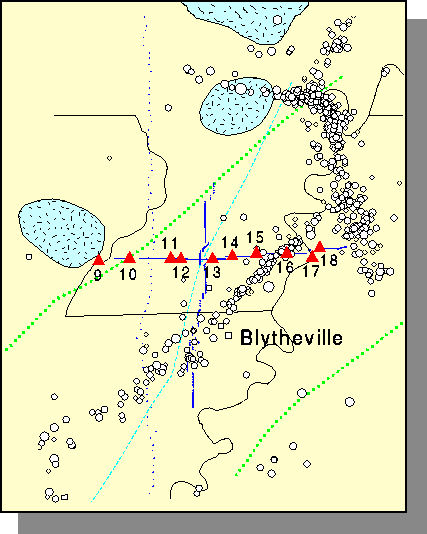
Much progress has been made in the last few decades identifying important regional structures that may be associated with the seismic activity in the central Mississippi Valley. Several of these structures are shown on the basemap, along with the locations of the refraction profiles and the epicenters of all earthquakes with magnitudes greater than 2.0 contained within the CMV earthquake Catalog.
Reelfoot Rift: The Reelfoot rift is a failed, Precambrian intracontinental rift (e.g. Kane et al., Geology, 1981) about 70 km wide stretching in a northeast-southwest direction for about 300 km. Estimates of the basement offset in the rift graben are approximately 2 km (Mooney et al., Tectonophysics, 1982). The rift boundary is inferred from maps of the second vertical derivative of the regional magnetic field (Hildebrand et al., 1977, 1982, USGS Publications).
The Blytheville Arch: The structurally-high Blytheville Arch is most easily identified on seismic reflection profiles, where it appears as a zone of disrupted reflectors. The inference is that the region is highly fractured and may contain rocks of significantly different material properties than those in the adjacent parts of the rift. The seismicity in the rift is closely aligned with the inferred trend of the arch suggesting a structural relationship.
The Bootheel Lineament: Apparent on satellite images and air-photos of the area, the Bootheel lineament divides regions of different soil type and 1811-1812 sand-blow characteristics. The lineament has been proposed to be a surface expression of a nearly vertical strike-slip fault, possibly a structure which ruptured during the major seismic events of 1811-1812 (Schweig and Marple, Geology, 1991).

A closer look at the profile locations relative to regional structures

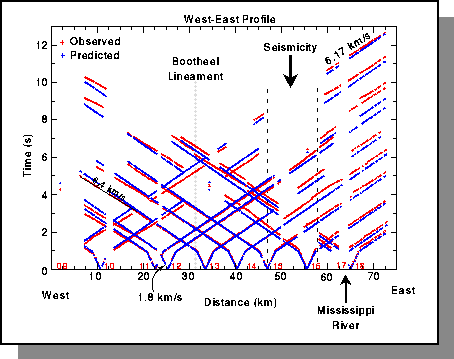
Observed first arrival times along the West-East profile are shown using small red crosses. The corresponding times for a single layer over a half-space model (vp = 1.89 km/s, h = 0.65 km; vp = 6.0 km/s) are shown using blue symbols. Important geological boundaries are indicated. The gray region identifies that part of the profile above the Blytheville Arch. Individual shot points are identified using red numerals.
The observed travel times are very linear, and faster in the west than in the east. At several positions, the travel time curves "jump" several tenths of a second, suggestive of subsurface heterogeneity For example, follow the east branch of the travel time curve from Shot 14 to a distance of about 50 km. Most of these temporal offsets occur in the region of the Blytheville Arch, consistent with the idea that the region contains significant offsets in subsurface structure. Record section showing the recorded waveforms from Shot 15, located just west of the intersection of the profile with the linear trend in seismicity.

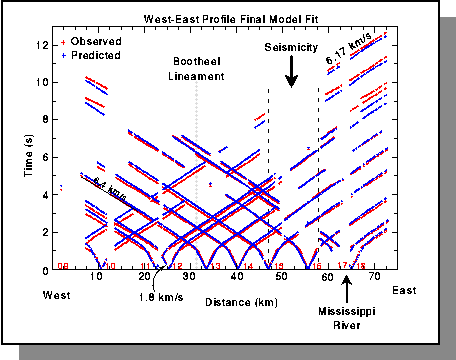
We inverted the first arrivals from the west-east line (3225 observations) to estimate the lateral variations in velocity in the upper few beneath the surface. We present results for a nine-iteration run, which produced a variance reduction of 75%. The final RMS error for the travel times is approximate 0.16 seconds. Most, but not all of the travel times fits are improved over the simple one-dimensional starting model. However, more improvement may be possible with the relaxation of the smoothness requirements on the model.

For these preliminary runs, we have ignored the low-velocity layer (LVL) present beneath the shallow sediments throughout the region. The LVL is invisible to the first arrivals, and arrivals from deeper depths only become first arrivals for offsets of 50-60 km (based on ray tracing models), approximately the length of the entire profile imaged in this study. Thus we are mostly restricted to imaging structure above the LVL.
