|
|
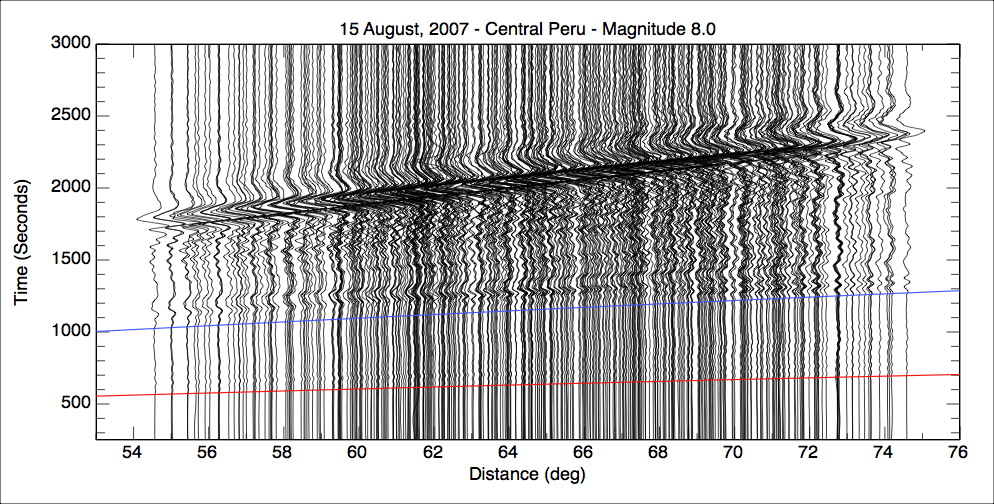
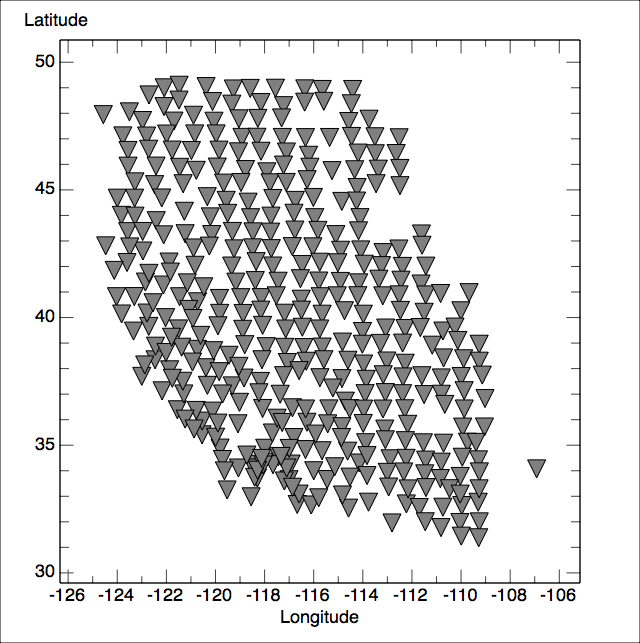
Central Peru - 15 August 2007, 23:40:48 UTC (Mw = 8.0) The animation shows the vertical ground velocity in the 100-50s period range observed across the western United States by the EarthScope transportable array and generated by the great 15 August, 2007 earthquake offshore centrl Peru. Each circle represents a seismometer and the colors change to reflect variations in the signal amplitude crossing the array. Near the end of this animation you can see the waves that traveled the long way around Earth to reach the western United States (they propagate from NW to SE). Station 319A is located at the Douglas, AZ. For more information on the earthquake, click here. A plot of the displacement seismograms used in the animation is shown near the bottom of this page. For the animation, I use velocity seismograms corrected for instrument sensitivity only - this enhances the shorter period components of the signal.
Selected seismic wave traveltimes (from Phillip Crotwell's version of taup) Gcarc = 54deg / Depth = 15 km
Phase Time Slowness
P 788.92 4.617
PcP 789.57 4.431
PP 1008.21 7.888
PPP 1126.93 8.824
SKS 1421.56 5.664
S 1451.01 8.912
ScS 1453.10 8.301
SS 1820.97 14.379
SSS 2039.46 15.637
PPP 2333.02 4.663
SSS 4285.94 9.291
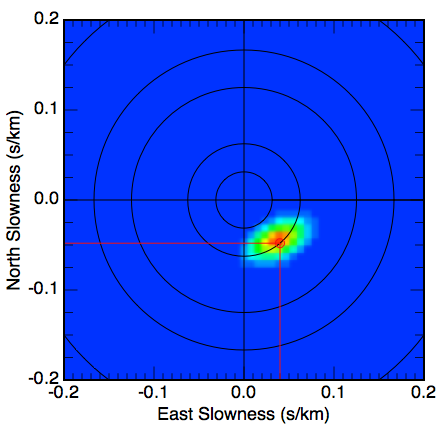
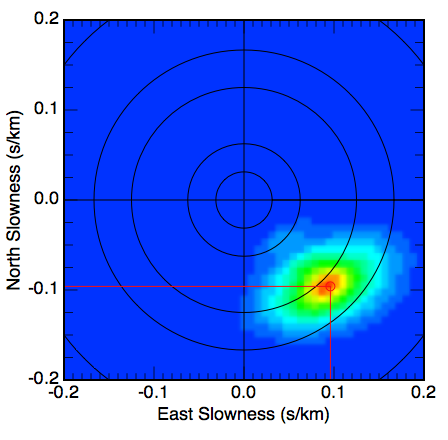
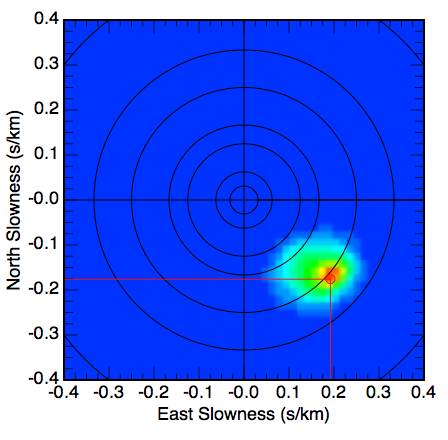
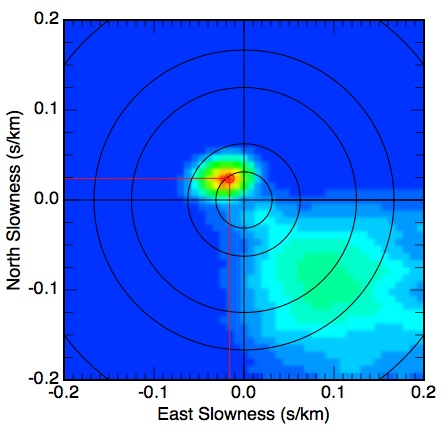
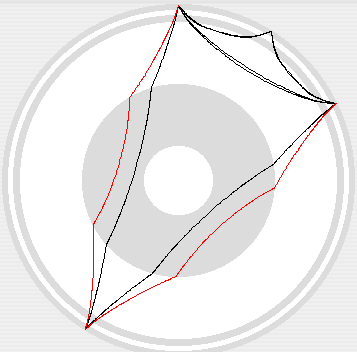
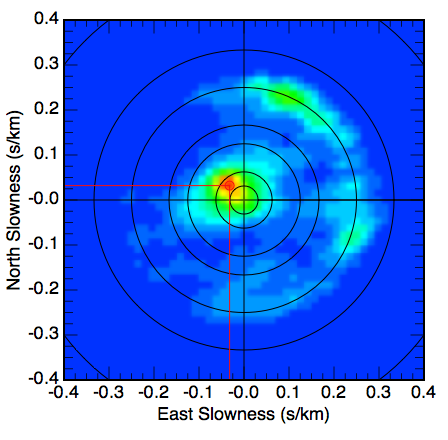
Slowness Spectra We can use the TA stations as a large (1500x1000km) seismic array to estimate wave phase velocity (the velocity at which a wave sweeps across a horizontal surface - Earth's surface in this case) and direction of approach, or azimuth. Some examples for the Solomon Islands earthquake are shown below. Warm colors, such as red, indicate substantial relative power arriving with a particular direction, which can be read like a compass (North at the top). The distance a spectral peak is from the center the slower the wave propagates across the array. The circles show velocities of 32, 16, 8, 6, 4, 3, 2 km/s respectively, starting from the center of each image. The color range for each image is self-scaled. The bandwidths used for body waves adn the coda are 200-25s, for the surface waves are for 200-25s. The large event size resulted in a source duration of about 60s, so much of the short period energy is filtered away by the earthquake rupture. Using a Cartesian coordinate system is an approximation, but the distortion is not too large, based on the images below. Note - the images are reduced for this summary display, open each image in a new window to see it full size.
|