
|
|
Kurile Islands - 15 November 2006, 11:14:17 UTC (Mw = 8.3) The animation shows the signal power in the 100-15s period range observed across the western United States by the EarthScope transportable array and generated by the 15 November 2006 Kurile Islands great earthquake. Each circle represents a seismometer and the colors change to reflect variations in the signal power crossing the array. For more information on the earthquake, click here. A plot of the displacement seismograms used in the animation is shown near the bottom of this page. For the animation, I use velocity seismograms corrected for instrument sensitivity only - this enhances the shorter period components of the signal.
Selected seismic wave traveltimes (from Phillip Crotwell's version of taup) Gcarc = 54deg / Depth = 15 km Phase Time Slowness P 563.32 7.307 PcP 628.20 3.817 PP 684.75 8.998 PP 692.67 9.954 PP 692.88 9.766 S 1019.45 13.526 ScS 1152.16 7.086 SS 1242.26 15.759 SS 1264.45 17.822 SS 1264.45 17.799 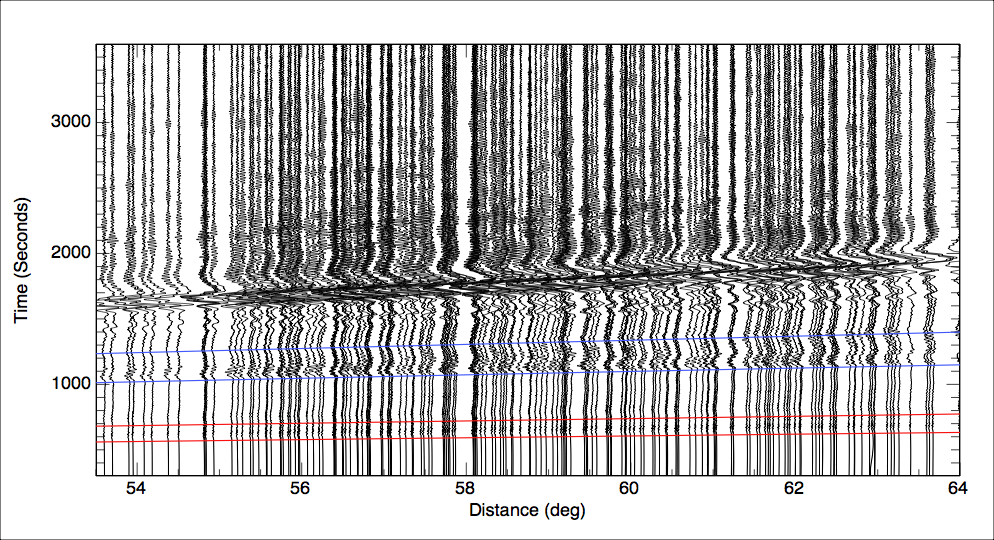 Vertical component displacement seismograms used in the animation. The animation illustrates the signal power (which is proportional to the square of the ground velocity). The two red lines show iasp91 P and PP times, and the two blue lines show the predicted arrival times of S and SS. Open image in separate window to enlarge. |