|
|
Southern Sumatra - 12 September 2007, 23:40:48 UTC (Mw = 8.0) The animation shows the vertical ground velocity in the 750-50s period range observed across the western United States by the EarthScope transportable array and generated by the great 12 September, 2007 earthquake offshore southern Sumatra. Each circle represents a seismometer and the colors change to reflect variations in the signal amplitude crossing the array. Near the end of this animation you can see the waves that traveled the long way around Earth to reach the western United States (they propagate from NW to SE). Station 319A is located at the Douglas, AZ. For more information on the earthquake, click here. A plot of the displacement seismograms used in the animation is shown near the bottom of this page. For the animation, I used displacement seismograms. If you have a problem viewing the animations: As I migrated from compression codec to compression codec, some of these files (the newer ones) require the DivX plugin for quicktime. So if you download a movie and try to run it in QuickTime, you may get a dialog box that directs you to a place to download and install a DivX plugin. Do that, it's free. Additional Animations:
* Normal modes are a standing wave view of the seismic wavefield. In this animation you see the ground sway and tilt. If you watch closely, you'll see the waves from the 06:01:34 Magnitude 6.4 aftershock sweep through. This movie starts several just over one day after the Mw 8.4 earthquake (the horizontal axis label is incorrect). The time step for this longer animation is 20 seconds per frame. Each second of this animation represents almost 7 minutes. I didn't screen the data so some seismic stations with glitches more or less have large amplitudes throughout the animation. The amplitude scale for this animation is about 1000 times smaller than the main-shock animations.
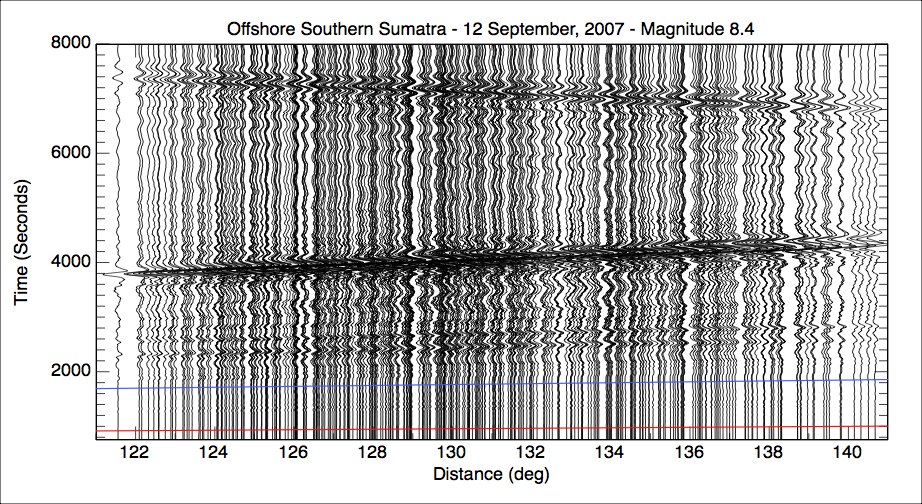
Selected seismic wave traveltimes (from Phillip Crotwell's version of taup) Gcarc = 132deg / Depth = 10 km Phase Time (s) Slowness (s/deg) Pdiff 967.11 4.439 PKIKP 153.34 1.873 PKiKP 1154.64 2.023 PP 1294.84 6.440 PPP 1465.35 8.029 SKS 1584.00 2.744 SKIKS 1584.73 1.777 SKiKS 1588.19 2.058 Sdiff 1785.97 8.323 PPP 2125.29 -5.705 SS 2353.05 12.185 SSS 2645.92 14.580 SSS 3879.08 -11.010291 Vertical component displacement seismograms used in the animation. The animation illustrates the signal power (which is proportional to the square of the ground velocity). The two red lines show iasp91 P times, and the two blue lines show the predicted arrival times of S. Open image in separate window to enlarge. At long periods, the long-arc Rayleigh waves arrive very soon after the short-period short-arc Rayleigh waves.
|