
|
|
Near Taiwan - 26 December 2006, 12:26:21 UTC (Mw = 7.1) - Long Periods (300s to 80 s) The animation shows the signal power in the 100-25s period range observed across the western United States by the EarthScope transportable array and generated by the 26 December 2006 Taiwan earthquake. Each circle represents a seismometer and the colors change to reflect variations in the signal power crossing the array. For more information on the earthquake, click here. Click here for more information on EarthScope; click here for information on the status of the transportable array. Selected seismic wave traveltimes (from Phillip Crotwell's version of taup), distance
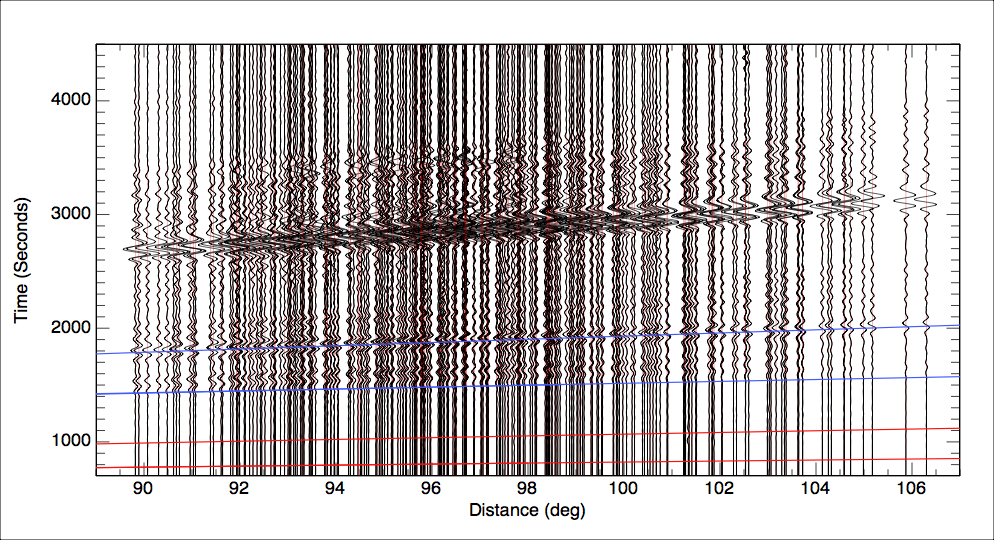 Vertical component displacement seismograms used in the animation. The animation illustrates the signal power (which is proportional to the square of the ground velocity). The two red lines show iasp91 P and PP times, and the two blue lines show the predicted arrival times of S and SS. Open image in separate window to enlarge. |