|
|
EpicentralAn iPhone/iPodTouch Application |
 |
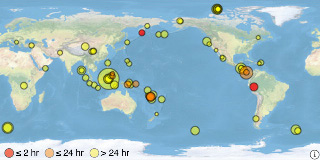
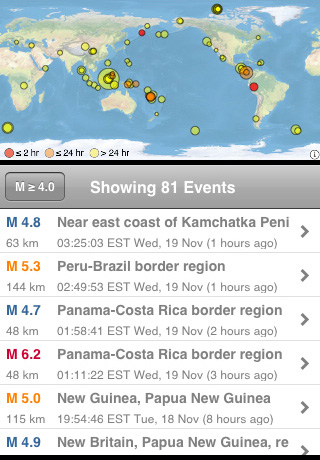
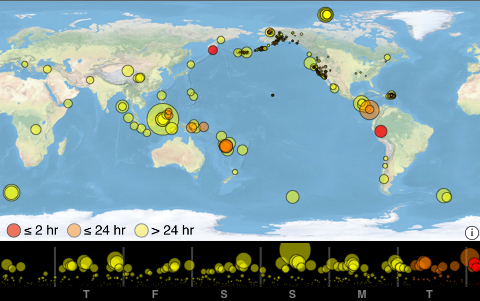
Overview: Epicentral is a network-based iPhone and iPodTouch application that displays a global map (and an earthquake-activity timeline when the phone is rotated) and list of earthquake epicenters for events that occurred during the last week. The data are served by the U.S. Geological Survey. List updates are possible each time the application is launched. Updates take a few 10's of seconds (on the Edge, G3, or wireless networks). Click here to open iTunes to the Epicentral page. The Map View: Symbols appear on the map as the data are downloaded. Map symbol colors indicate the time when the earthquakes occurred. Yellow indicate events that occurred 24 or more hrs ago, orange symbols identify events from the last 24 hrs, and red symbols identify events from the last 2 hrs. The size of the symbol increases with magnitude. You can filter events by touching the map near an earthquake symbol. To return to the full map or list of events, touch away from any of the currently visible events. If you rotate your iPhone or iPod, you will see a slightly larger map and a time line of recent activity along the bottom (the day of week is abbreviated along the bottom and the vertical lines represent day boundaries in local time). Symbol size and colors are the same on the time line as on the map. Time-line symbols are also shifted upward for larger magnitudes. You can touch near symbols on the map to see when they occurred, or touch near a symbol on the time line to see where the events occurred. Touch an empty region to restore the full data set to the display.
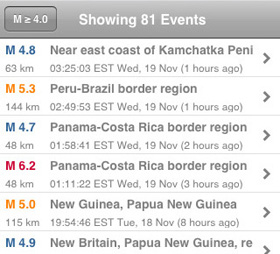
The List View: Earthquake information is also displayed in a list. The information is sorted so that the most recent events are at the top of the list. Each entry in the table corresponds to one earthquake. Magnitude, depth, and proximity to human populations, and building practices are the most important parameters determining the likelihood of damage caused by an earthquake. Large earthquakes that are quite deep (greater than about 70 km) are usually not a threat. The magnitude is shown color-coded on the upper left. Red indicates earthquakes with magnitudes of six and larger, orange for magnitudes between five and six, then blue, green, and gray for magnitude ranges of four-to-five, three-to-four, and two-to-three respectively. The depth in kilometers (1 km ~ 0.6 miles) is shown beneath the magnitude. You can filter the list and map to show only magnitudes greater than the value shown in the button on the left of the table title bar.
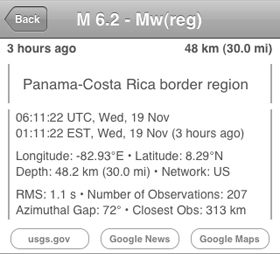
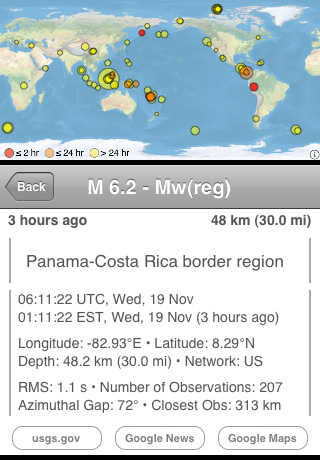
The Details View: If you select an event from the list, you see the detailed information about the earthquake. The complexity of the information increases as you read down the view. The top lines show the estimated origin time (when the earthquake occurred) and the location (latitude, longitude, and depth). The last two lines contain information related to the earthquake location quality. For example, RMS indicates the Root-Mean-Square misfit of the observed seismic wave travel times (which are used to locate the earthquakes) - small RMS values are better. Network refers to the seismometer network that provided the location. I've noticed that not all networks provide accurate values for all the secondary information parameters (gap, etc.). You can find the details on each parameter and the networks on the USGS earthquakes site (earthquakes.usgs.gov).
The buttons at the bottom of the detailed information view launch Safari or the Map app (Google Maps Button). Right now the zoom on the Map app does not seem to work, which I think is an Apple bug. The result is a map way over-zoomed on the location. You have to zoom out to see any geographic information on most of the planet, but it's ok within the US, for example. The Google News button submits a search request to Google through Safari. Remember that small earthquakes generally don't make the news unless they are in unusual places. The Notes: You will see that information on small earthquakes (magnitudes less than about 4.0) is available only in regions where the USGS and their collaborators maintain dense seismometer networks, such as California, Alaska, Puerto Rico, etc. Small events are occurring all over Earth's plate boundaries, we just don't locate all of them, so they are not displayed. You can find many of the details on the parameters and networks at earthquakes.usgs.gov, or click here. I have plans to improve the application. Some level of map zooming is obviously high on the list, but I am hoping to use the existing mapping tools for the very close-up views. At some point I'll add perferences to allow customization. |
|
|
Acknowledgements: Special thanks to Julie, Charlie, and Lynn, who let me work on this app during the evenings of the last month. Thanks to the scientists and staff at the USGS and their collaborators for the data feeds and especially to those at the USGS' National Earthquake Information Center for comments and endless discussions on interesting earthquakes. Thanks also to Kevin Furlong for comments, suggestions, and for testing the app on his phone. Disclaimer: Epicentral is an educational utility, not an authoritative tool for earthquake monitoring. I developed it so that I have a convenient tool to access earthquake information and to show students the location of recent earthquake activity. The data are served by the US Geological Survey, they are the authorities on these issues. You can find and older version of Epicentral for MacOS X here. |
Last Updated:20 November, 2008