SAC is a useful and convenient tool for examining small numbers of seismograms. If you learn the SAC macro language you can also process large numbers of seismograms. In this example I outline the methods for creating a simple SAC plot on the screen and in PostScript, the graphics language from Adobe that allows high-resolution, vector display of graphics. We'll work with a very simple example using a function-generated impulse.

Generating the Sample Signal
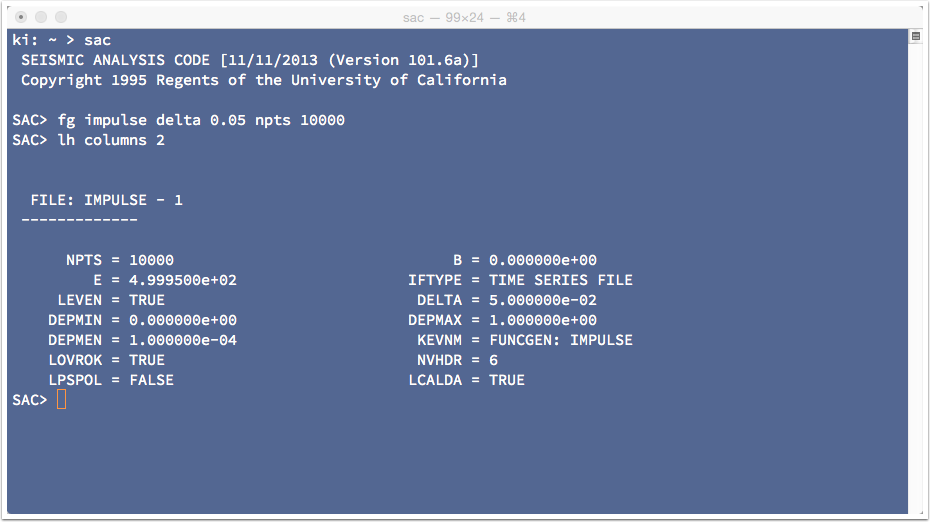
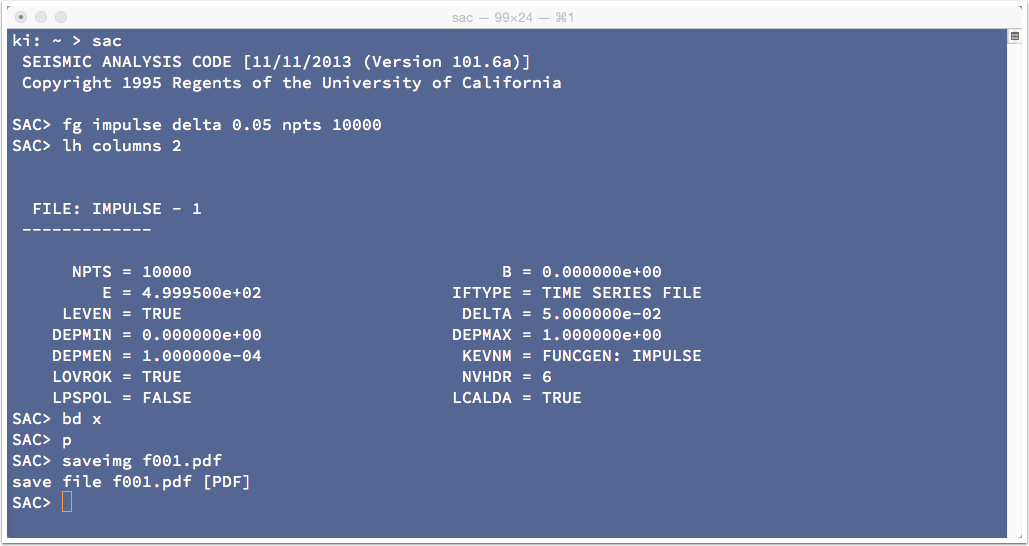
Start SAC and create an impulse using the "funcgen" command. I use fg to abbreviate the command name and creat an impulse with sample rate of 0.05 s and 10,000 samples. The "fg" command creates the signal, the "lh" command simply lists the values in the genearted signal's header.
Plotting to the Screen
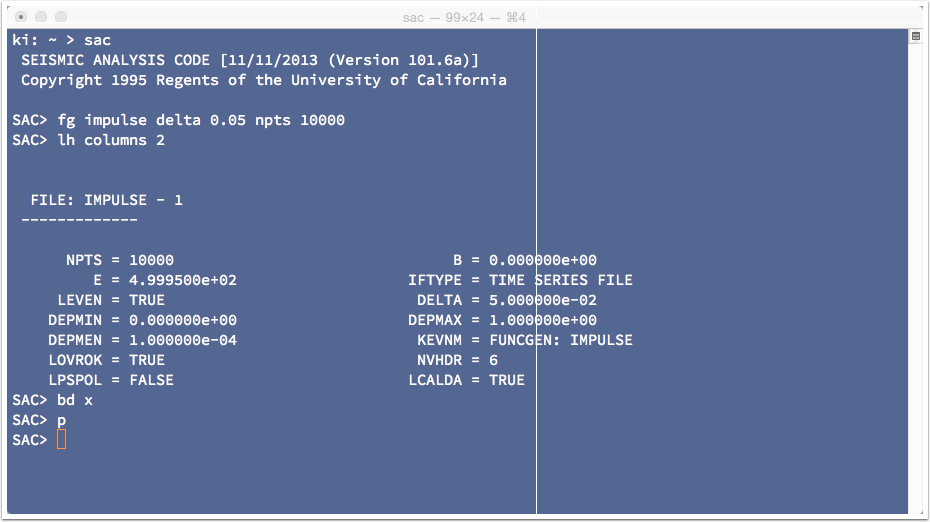
To generate a plot on the screen I first select the X-Window graphics device with the begindevice command (which I abbreviate as "bd"). The "bd" command opens and XWindow, which becomes the active window. To execute another command you have to click in the Terminal. Then I issue the plot command (which I abbreviate as "p").
The XWindow Plot
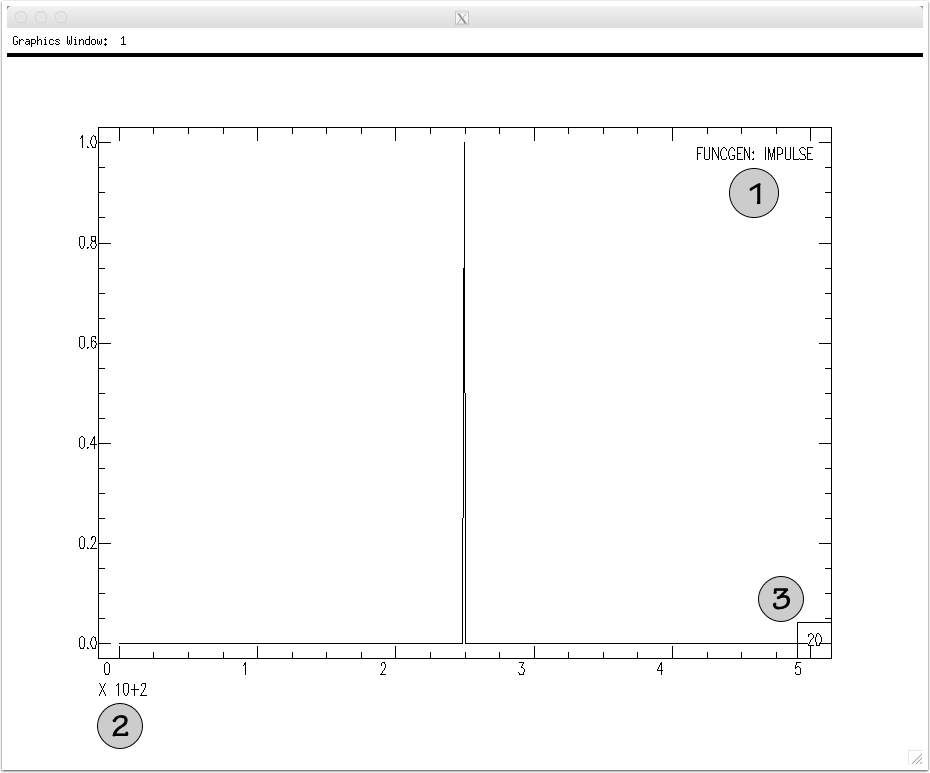
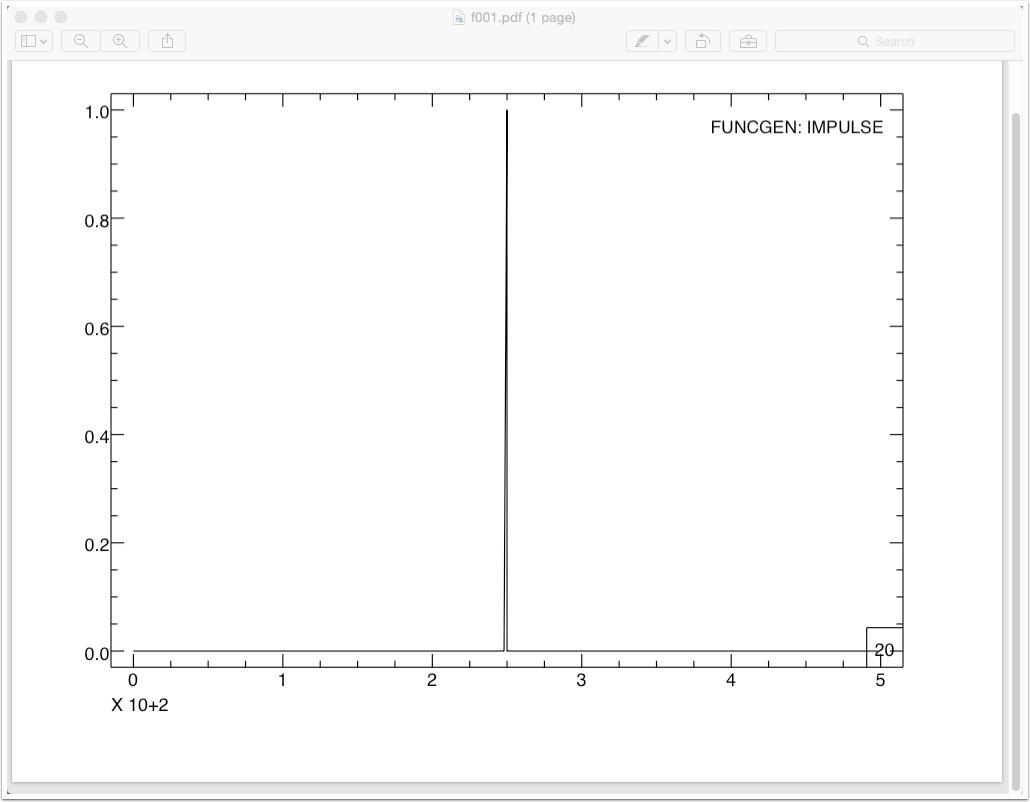
Here is the resulting XWindow plot. Nothing fancy, just a very simple display. Note that the SAC fonts are software-based, they are simple shapes drawn by connecting lines together. Let's look at three items in a standard SAC plot.
- This is the File-ID. In this case it is a simple label, for other plots it can list the station information, seismogram start time, etc.
- This is the horizontal axis exponent, and it's a weird way to display this information. The 10+2 indicates 10^2 = 100, and it is a multiplier for the major tick values on the axes. Thus "1" actually represents 1 x 100, etc.
- The value in the lower right is a plot-decimation factor. The larger the number the fewer points are used in the display. This allows the plot to display faster or the size of the graphics file to be reduced. You control plot decimation using the command "qdp", which is an abbreviation for quick-dirty-plot.
Making a Hard Copy - saveimg (SAC versions 101.5+)
You can save the plot as a PDF file using the "saveimg" command if you are using one of the latest versions of SAC. The command is quite simple, once you have the plot looking how you want it, you just eecute the command "saveimge FILENAME.pdf". The command uses the suffix to determinar the file type. A nice feature of this command is the use of hardware fonts (real fonts) in the plot. The older way of generating a SAC graphic is described below and uses software fonts (letters are sketched using mulitple line strokes).
Here is the PDF file created using the "saveimage" command. As usual, the default font is way too small. You shoud use the command "gt size large" to use a more appropriate font size for your plots.
Creating a Hard Copy - SAC Graphics Files (The Old Way)
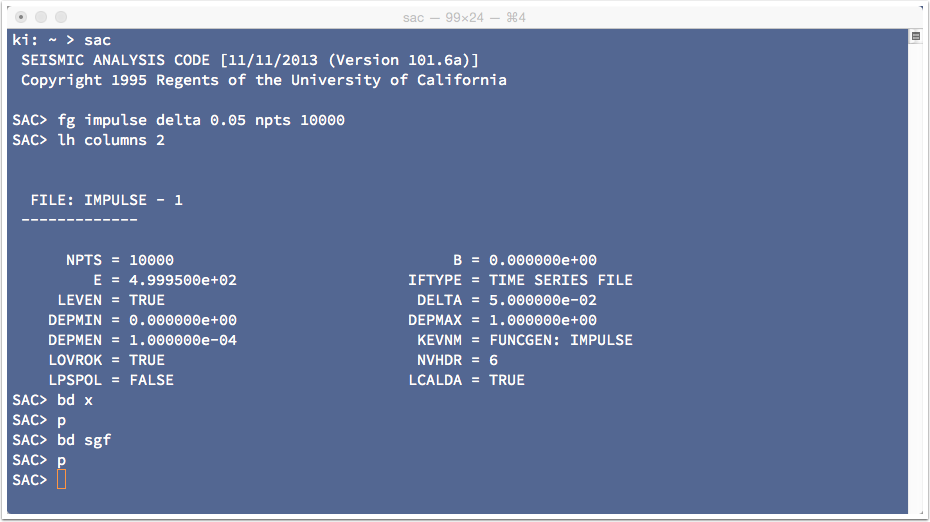
Creating a hard-copy version of the plot requires two steps. First you direct SAC to write a SAC graphics file (e.g. f001.sgf), then you convert the "sgf" file into a printable (or editable version) using one of the utility codes included in the SAC package. Let's start by directing SAC to output the graphics. We select the graphics device called "SGF", then issue the plot commands. SAC automatically creates a sequentially numbered graphics files in the working directory. They have the form fxxx.sgf where "xxx" is an integer from 0 to 999. You can control the exact file name if you want, but we will use the defaults.
SGFTOPS
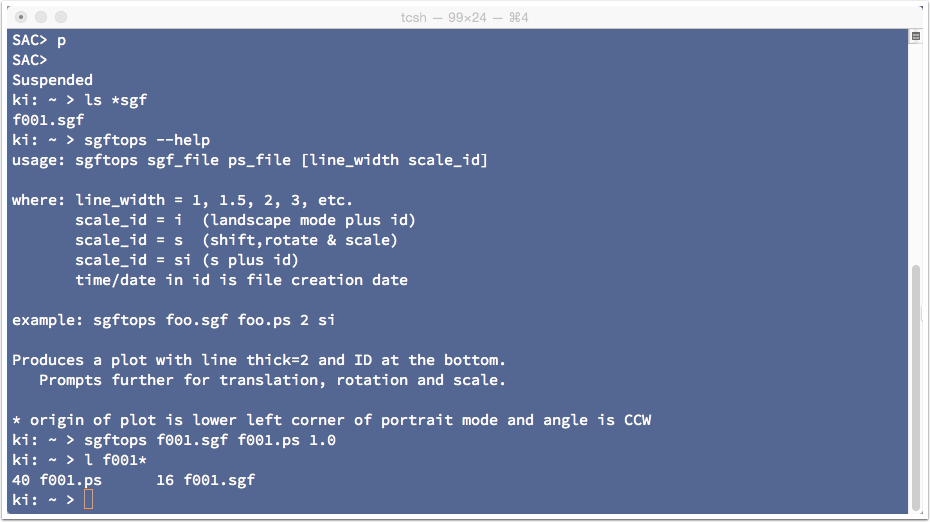
I suspended SAC using Ctrl-z and listed the files with a suffix "sgf". Then I executed the command, "sgftops" that we will use to convert the sgf file to a postscript file. This time, however, I only asked sgftops for the help message.
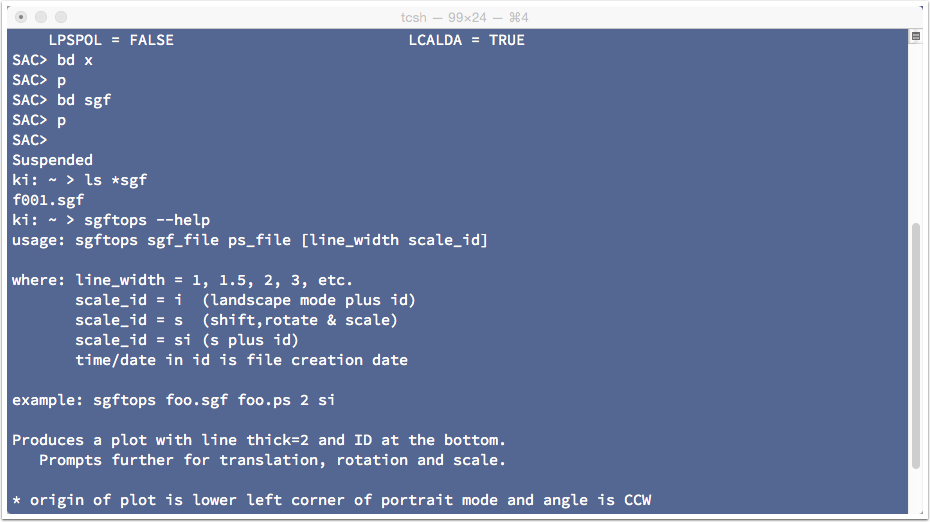
Using sgftops is pretty simple, on the command line you provide the name of the sgf file and the name of the output file. There are other options as well. I'm going to use one - to increase the line thickness (I think the default line thickness is just too thin). The result is a new file, called "f001.ps", that contains the plot.
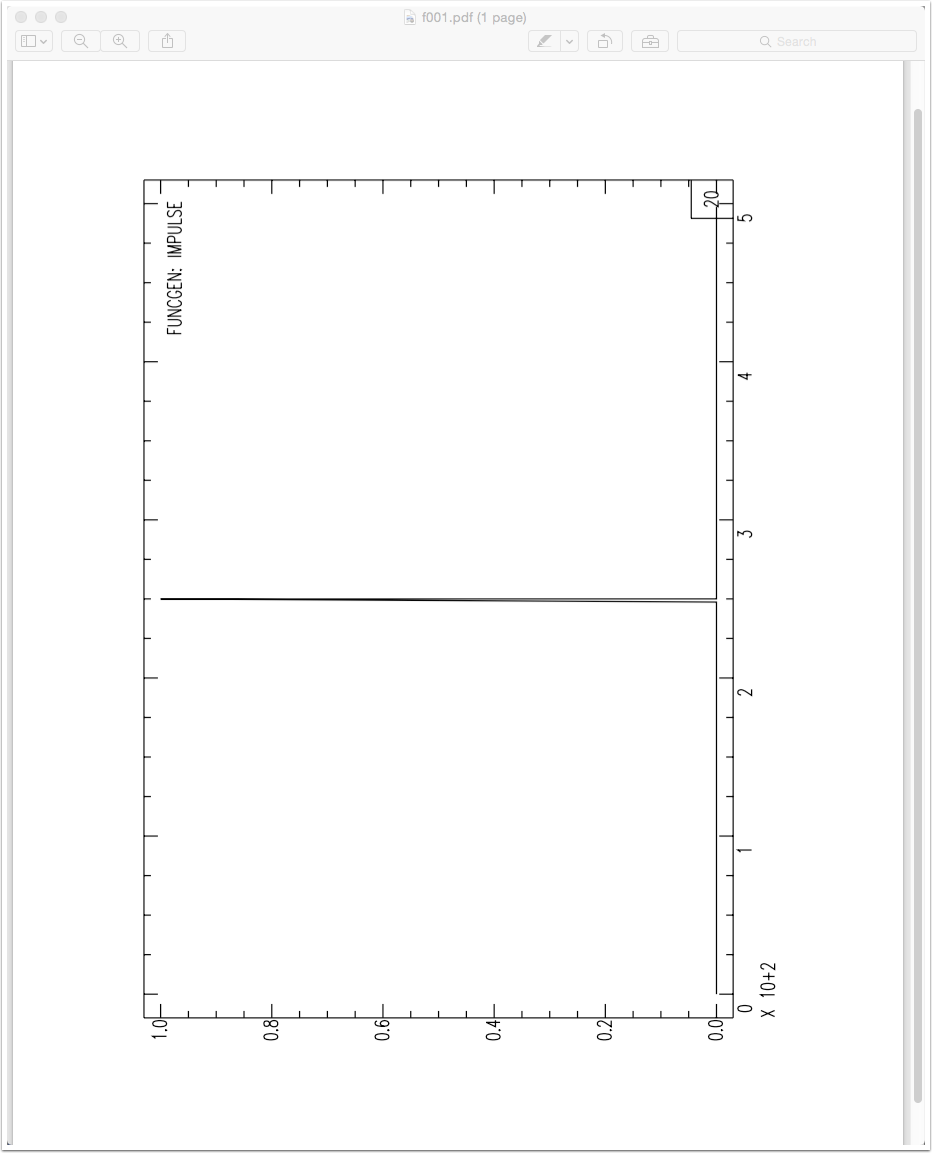
PostScript
Postscript is a graphics language and the file f001.ps contains a graphics program that draws the chart. Postscript is the precursor to Adobe's familiar portable-document-format (PDF). You can preview the postscript with ghostscript (gs) in linux, Preview on a Mac, load it into a graphics tool like Illustrator for editing, or send it directly to a postscript-compatible printer. Here's the result in Preview.