Acquiring Seismic Data From IRIS
IRIS is the source of information on seismic stations and their seismograms, and includes a number of other useful data-related services to compute instrument responses, traveltimes, distances, and azimuths. The most modern and best way to acquire data is to use the IRIS web services. The place to start is http://services.iris.edu.
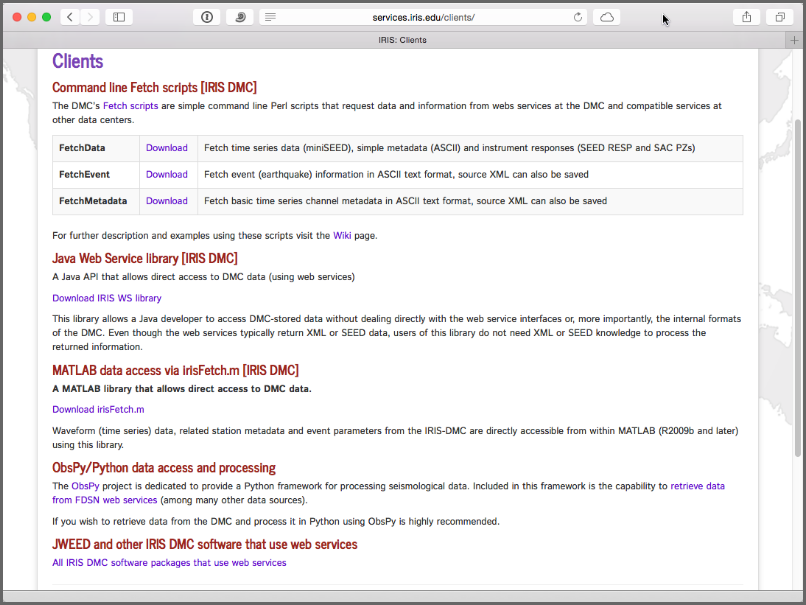
You can use the services to get a quick look at a signal or you can use a set of programs or scripts (python, matlab, or command-line perl) to acquire large data sets. We'll walk through a simple example of getting a plot of a specified station and time. IN later activities we will acquire a suite of seismograms.

IRIS: Clients
You can use the services to get a quick look at a signal or you can use a set of programs or scripts (python, matlab, or command-line perl) to acquire large data sets. We'll walk through a simple example of getting a plot of a specified station and time. IN later activities we will acquire a suite of seismograms.
The TimeSeries Service
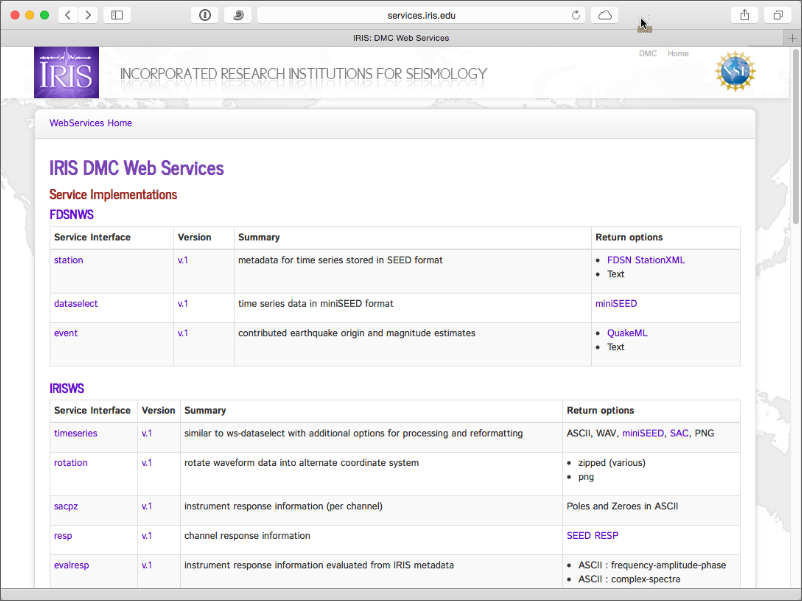
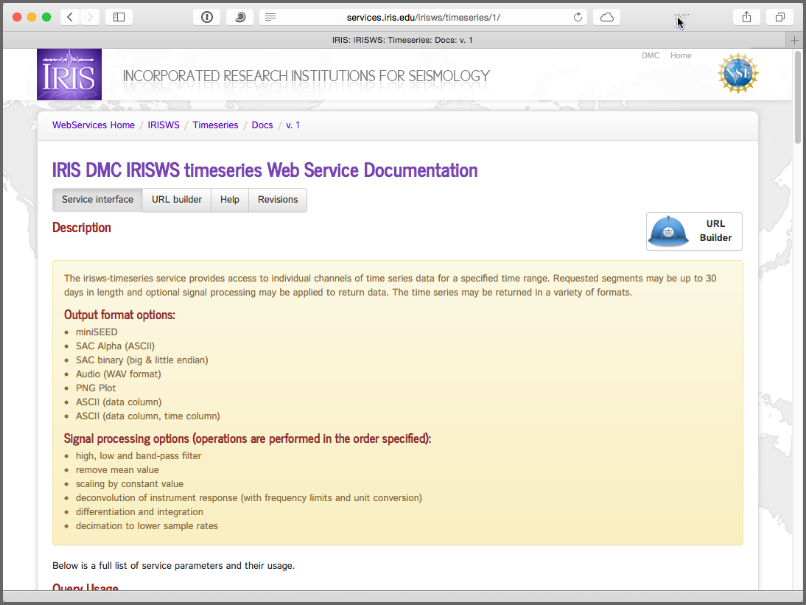
If you want a quick display of a seismogram, you can use the time-series service, which is not the best way to get large quantities of data, but is ideal for a quick peak at an earthquake signal. Go to the services.iris.edu home and click on the "timeseries" link. The first page is a description of the service.
Read over the descriptions, just to get a feel for the parameters that you can specify during a request and to see the various forms in which the output can be returned.
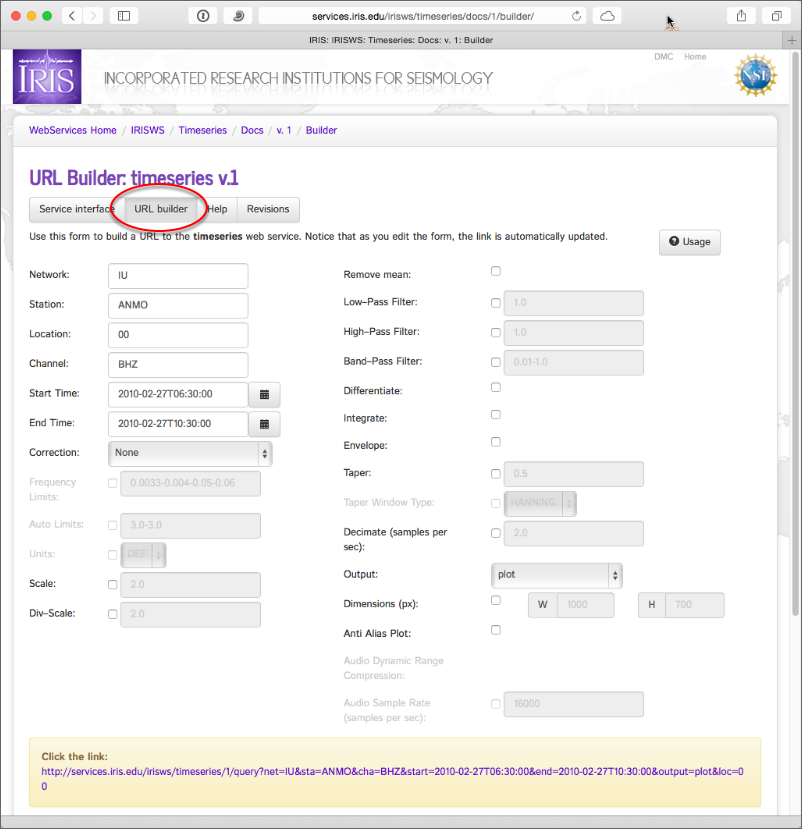
The TimeSeries URL Builder
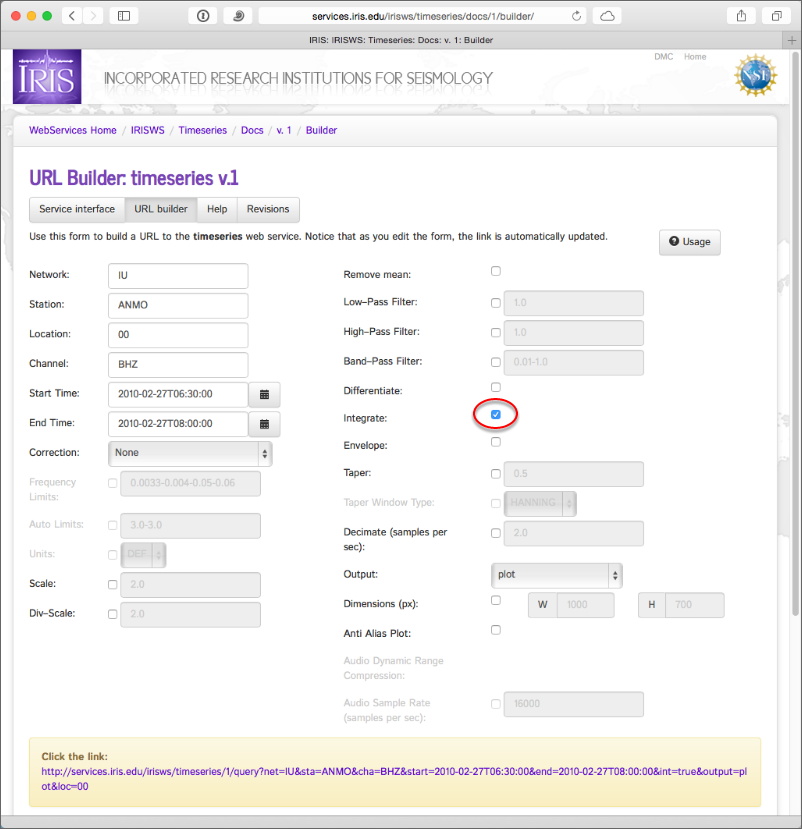
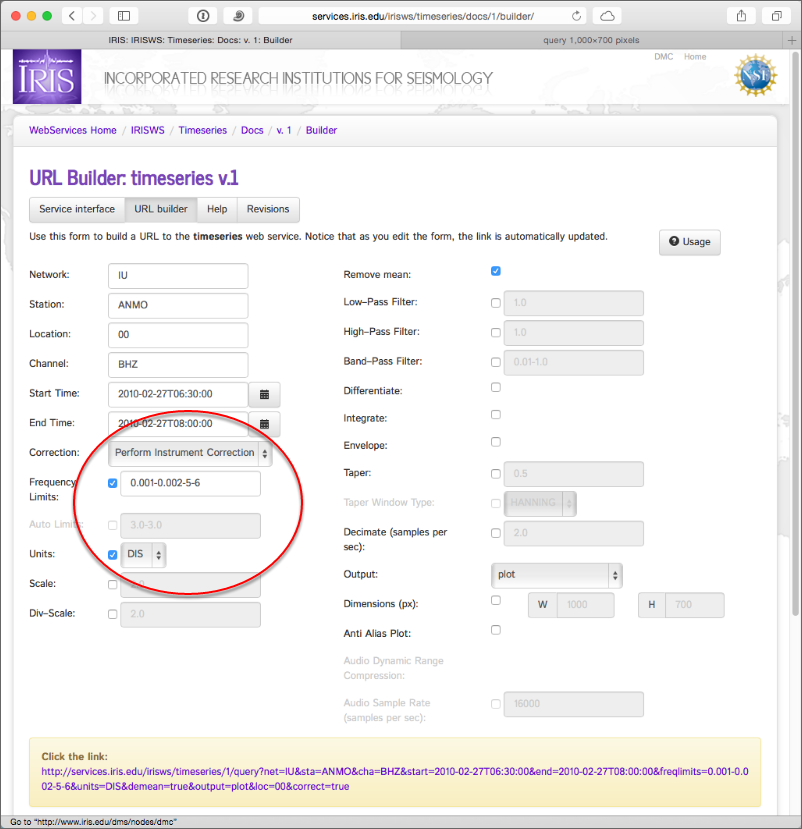
The best way to get a feel for the service is to make a nearly-interactive request. Click on the "URL builder" tab and you will see the form shown below. The way the form works is you select paramters to describe what you want and then you click the purple link at the bottom of the form to acquire the data. The default output format is a plot that opens in a new tab in the browser.
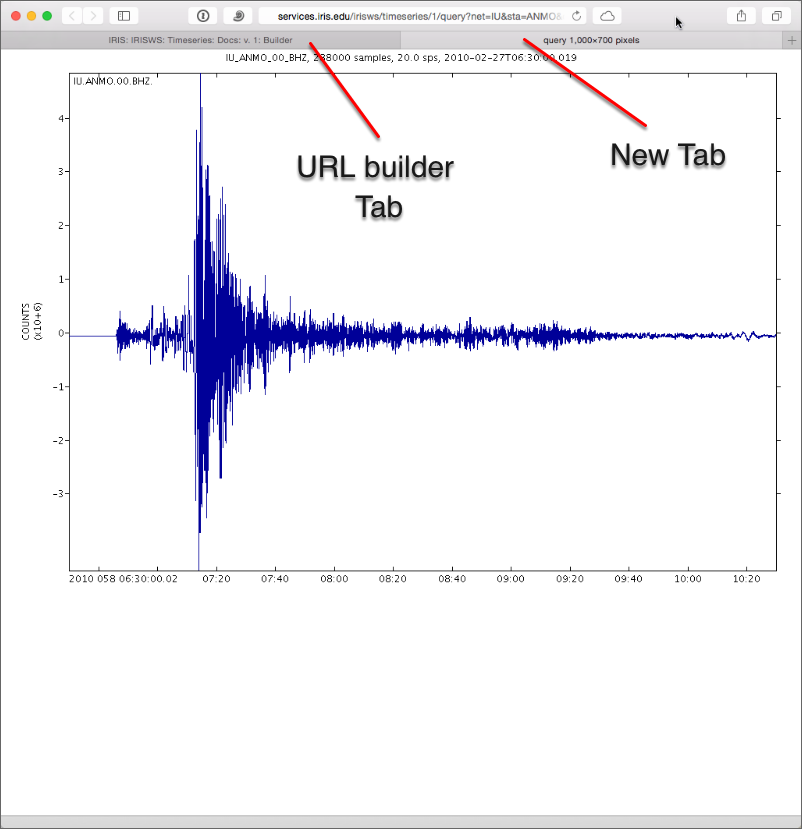
The Default Seismogram
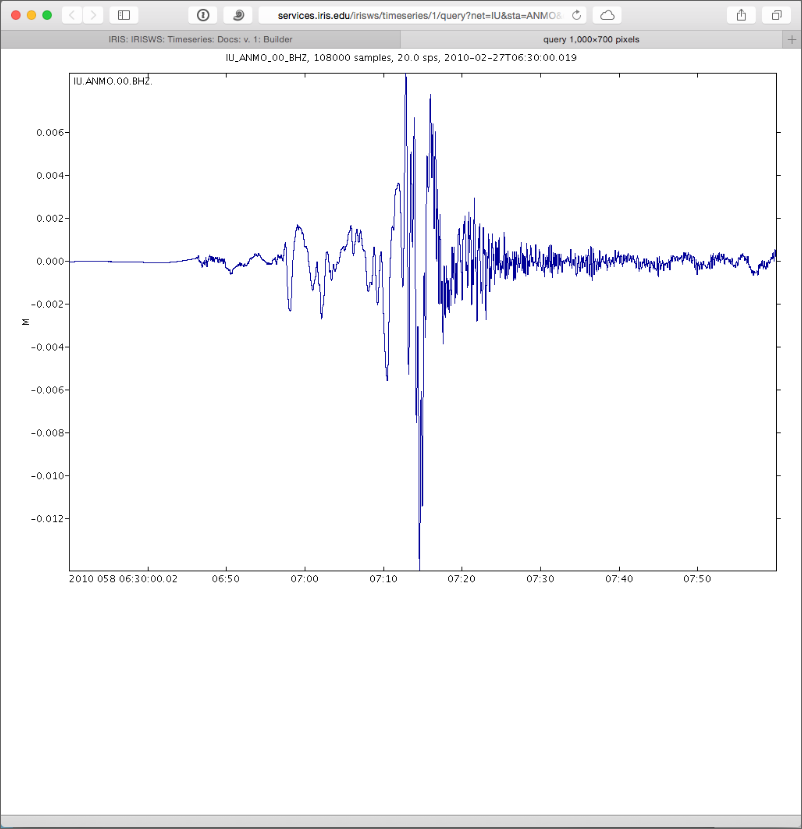
Click on the link before you make any changes. You'll see the chart below, which shows the vertical component, uncorrected (for instrument response) seismogram recorded at station ANMO (Albuquerque), New Mexico, USA
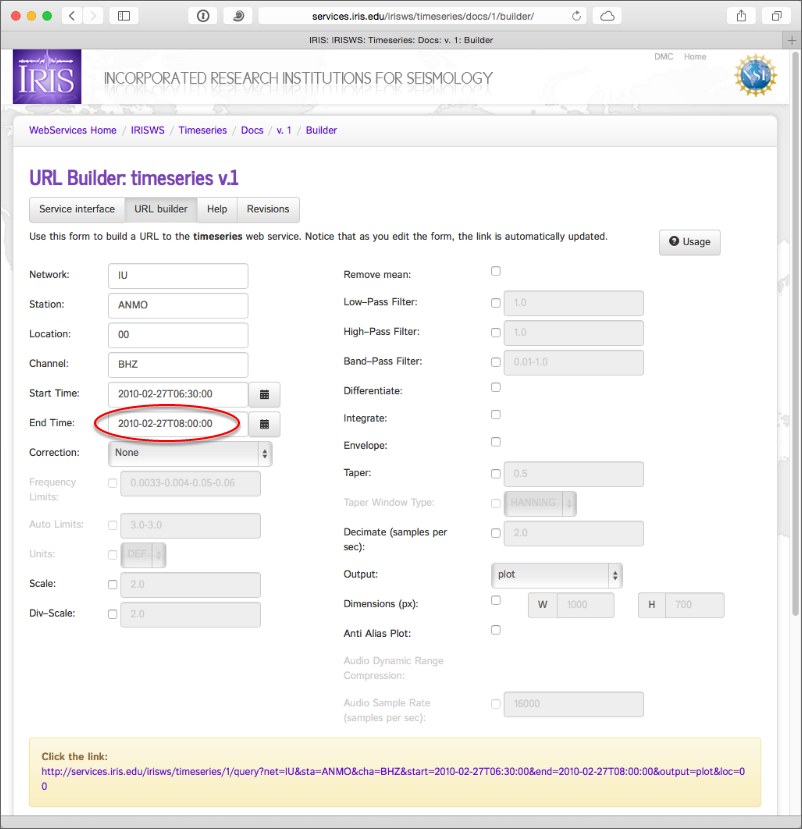
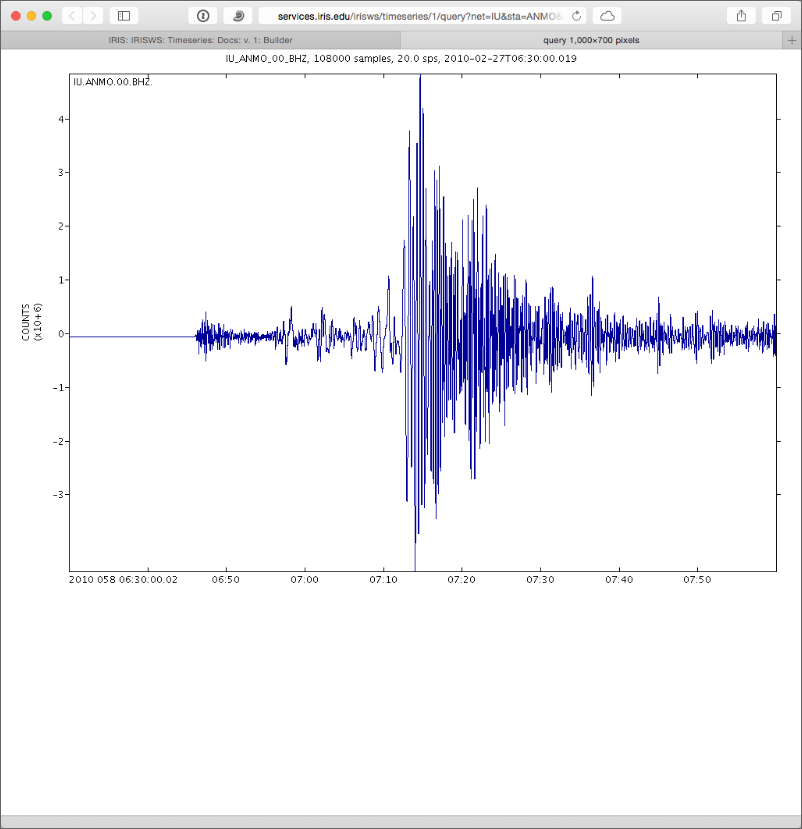
Adjusting the Time Range
You can use the fields in the form to adjust the output. In the example that follows I adjust the time to acquire just one and one-half hours of data. Go back to the URL builder form and change the "End Time" of the seismogram request. Note that the link at the bottom of the page (the URL of URL builder) changes each time you change one of the parameters. Then click the link at the bottom.
Basic Signal Processing
For the large Chilean event that produced these signals, very little processing is needed to see an interesting signal. But the timeseries web service offers the ability to process the signal when needed. The default signal for this type of seismometer is a ground velocity record, choose to integrate the signal to create a seismogram proportional to ground displacement.
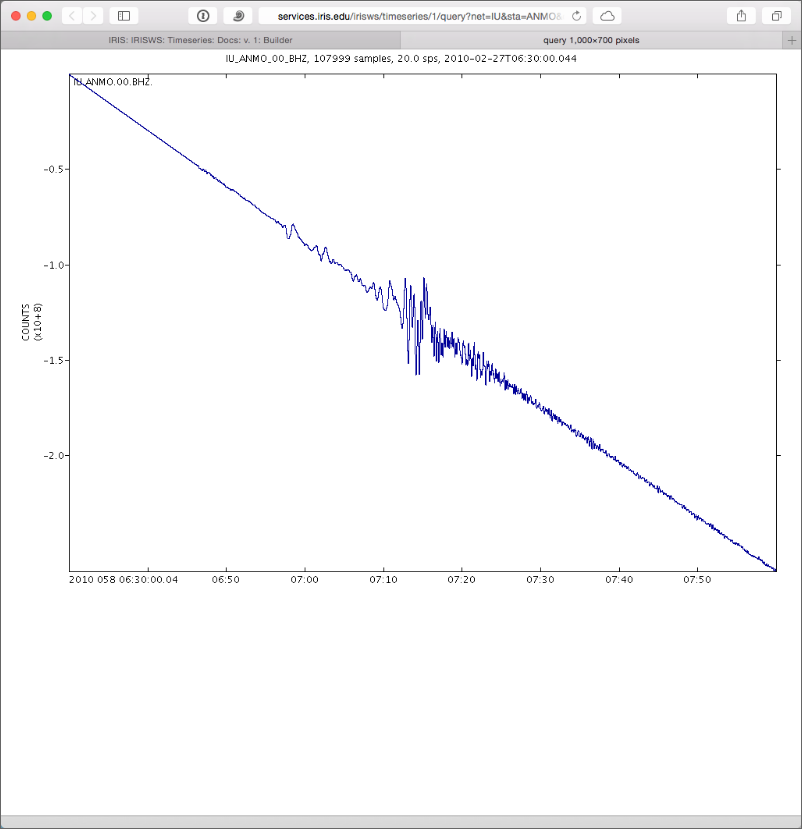
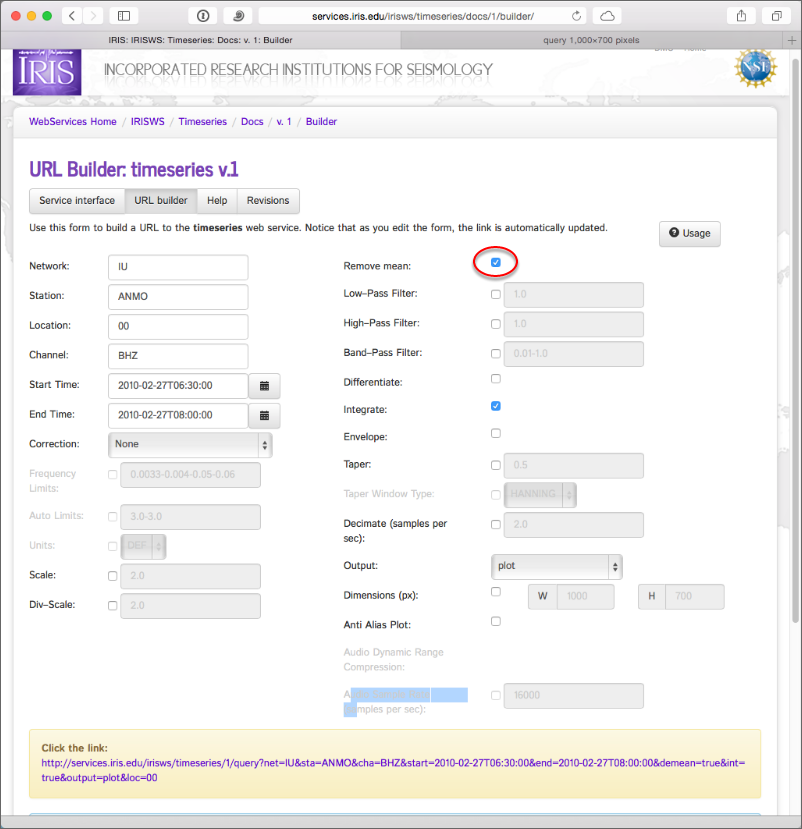
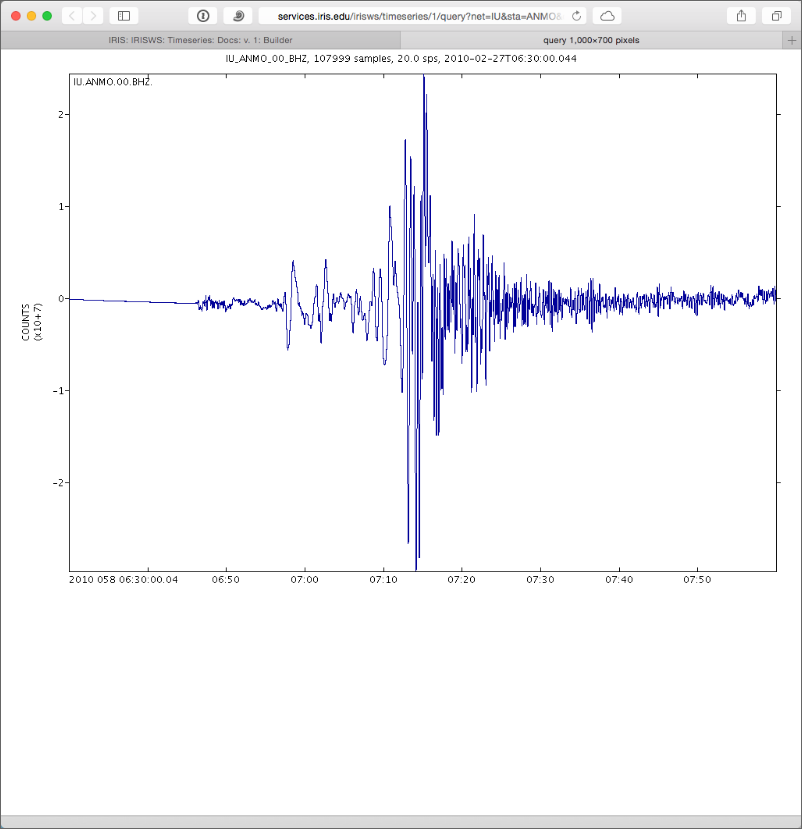
What happened? We integrated a non-zero mean seismogram and obtained a linear function. Remove the mean before integrating.
IRIS: IRISWS: Timeseries: Docs: v. 1: Builder
Instrument Response Removal
We can also removed the instrument response (or just the gain). This can be tricky with band-limited data, and so requires some experience. Here's what I get for signals from this large event. Note that the units for the vertical axis are in meters (M), and the values exceed a centimeter, which is very, very large.