The timeseries web service is fine if you just want to get a few waveforms to check a signal or select an example. However, it is completely impractical for gathering large, research data sets. The best way to do that is with more formal requests. However, for event-centric data ("get all the data for a particular event"), you can use the Wilber interfaces available from IRIS. For larger events, IRIS gathers together all the waveforms that are available and creates a package that allows easy selection and download of subsets of the available stations and channels. You can download the data in SEED format, which is an efficient compression standard used for the exchange of seismic time-series data. If you get the data in SEED format, you'll need the rdseed (read-seed) tool to translate to a format more suitable for analysis, such as SAC. You can get rdseed from IRIS.
Again, there are many details for you to track down online, but I'll outline an example download of data from an earthquake.

IRIS's Wilber 3
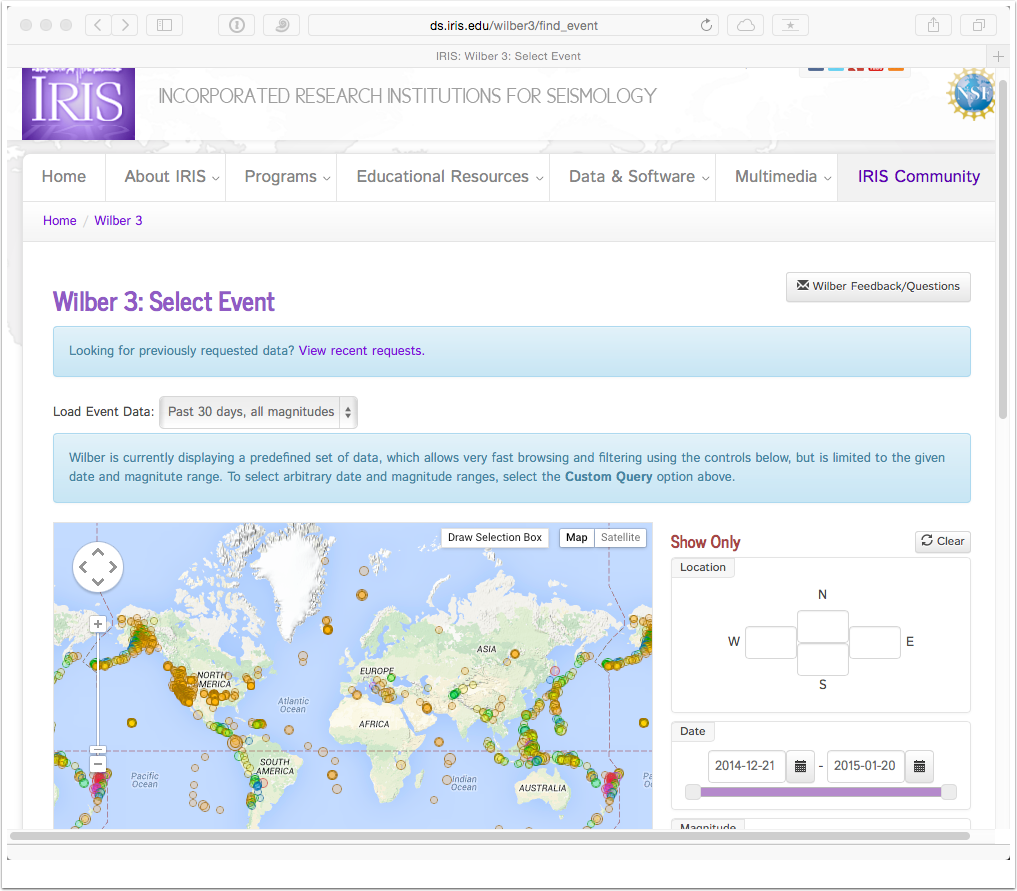
IRIS has been developing Wilber products for years, the latest version is Wilber 3, which you can find at http://ds.iris.edu/wilber3/find_event. Her's a screen shot of the tool.
The workflow is pretty simple, you select an event using the interactive map and eventually the table of events below it, then select the stations and channels that you want. Then you request the data, wait a bit, and download the data.
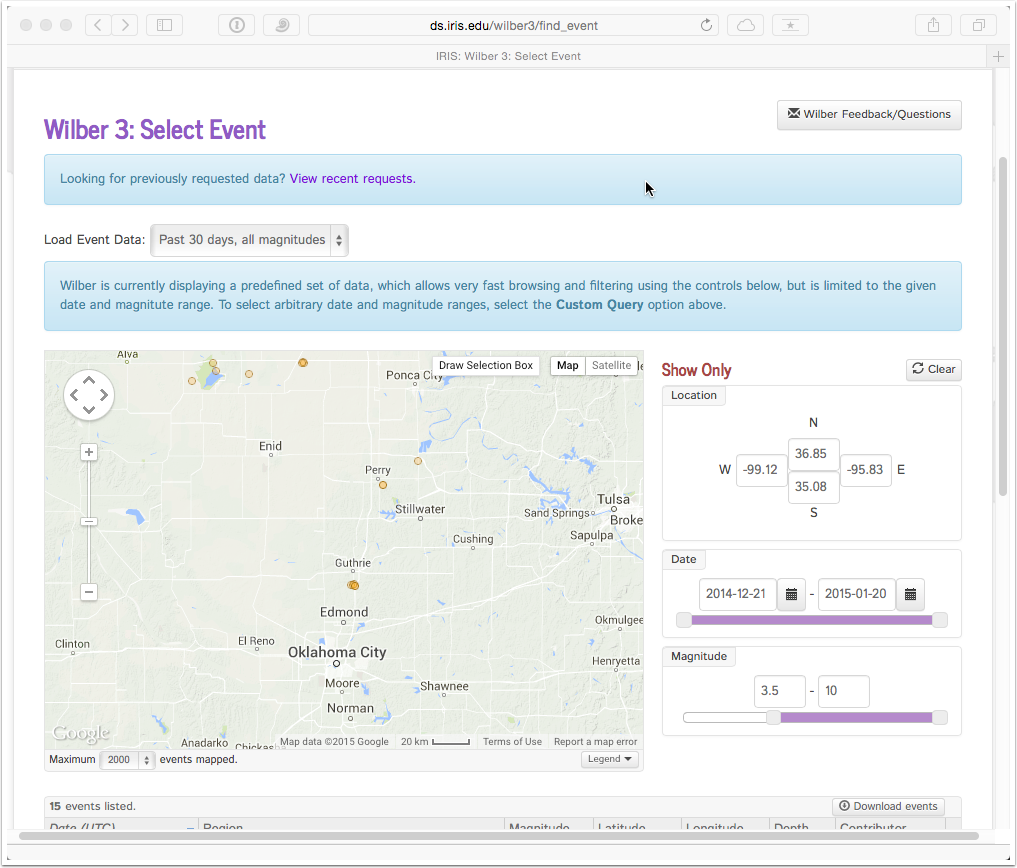
Let's select an event. Wilber knows about events of "all" magnitudes for the last 30 days, events with M ≥ 4.0 for the last year, and events with M ≥ 5.5 since 1990. I'll select a small event from Oklahoma in the last 30 days and then acquire data from the closest station. Using the sliders, I selected events with magnitudes greater than 3.5.
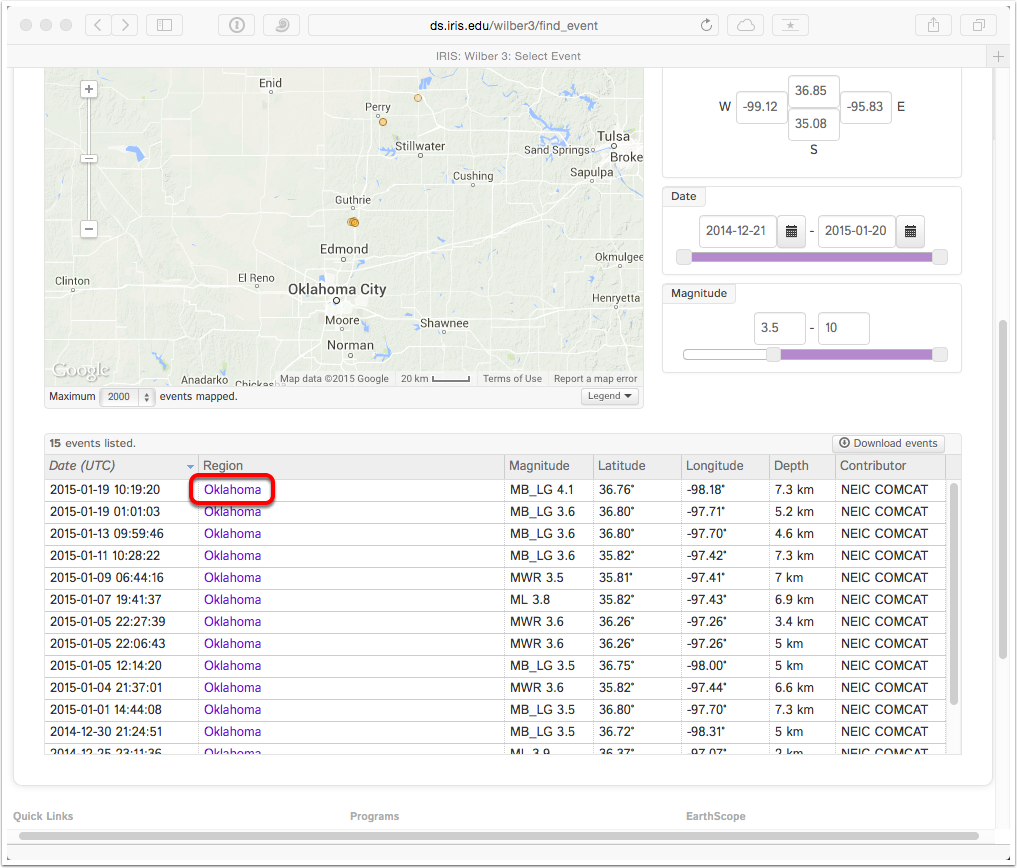
Now scrolling down to see the event list, I'll select the most recent event from the top of the list by clicking on the link under the "region" column, in this case "Oklahoma".
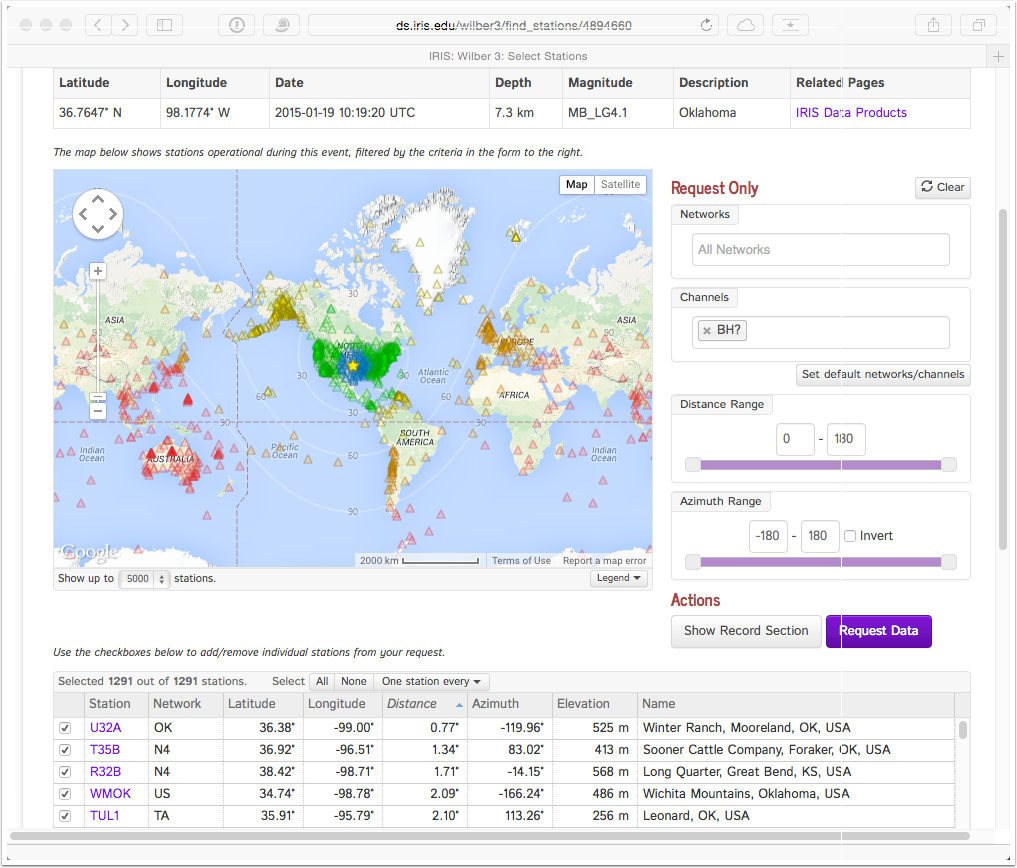
That resulted in 130 stations shown on the map below. But note that the Networks has defaulted to _GSN, which corresponds to the Global Seismic Network. The other defaults, such as "Channels" are fine for our purpose.
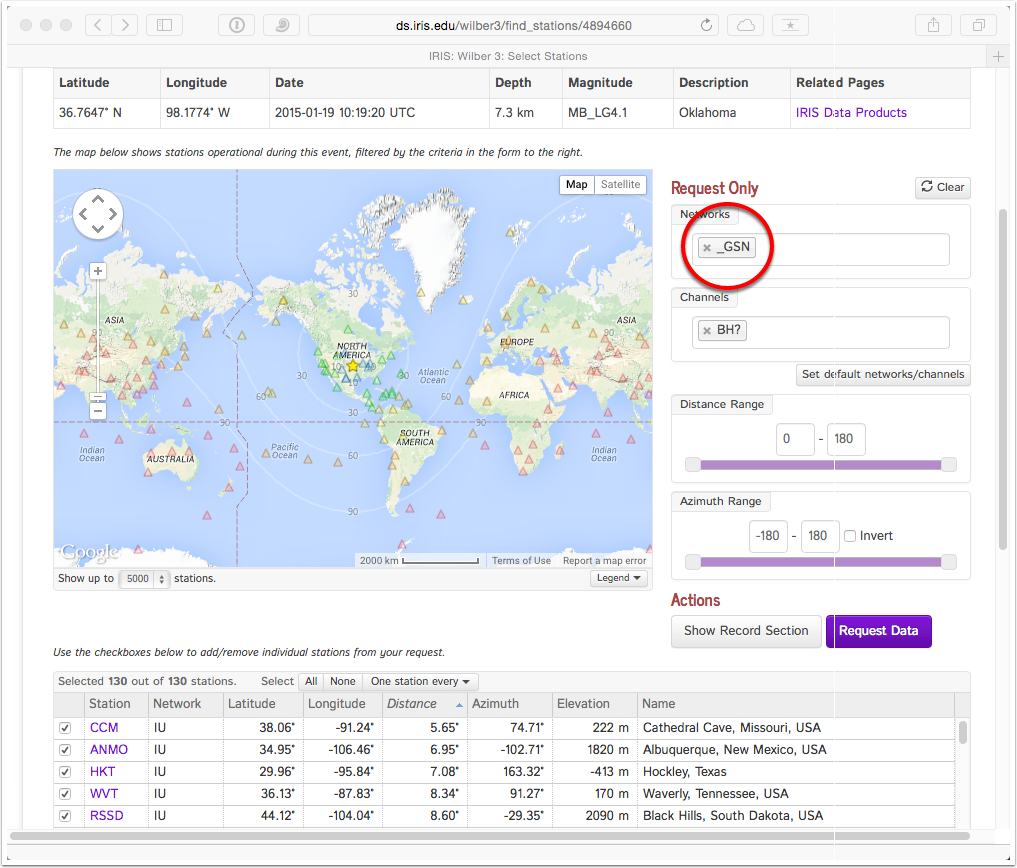
I want to see all the available stations, so I deleted the default network selection and wait for the refresh. Now I have access to 1,291 stations. I only want the closest, and the station list is already sorted by station distance, which means that I only want to data from the station U32A, listed in the first line.
By default all the stations are selected, which is not what I want. I click the Select "None" button and then choose just the station that I want.
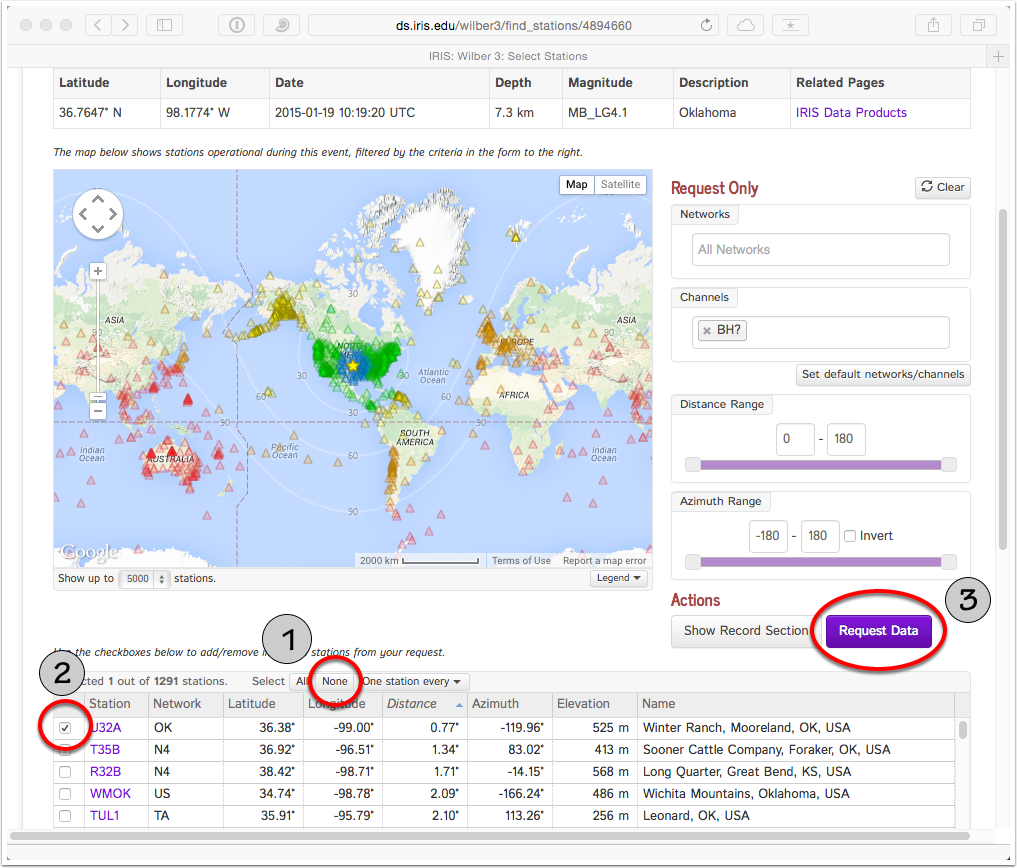
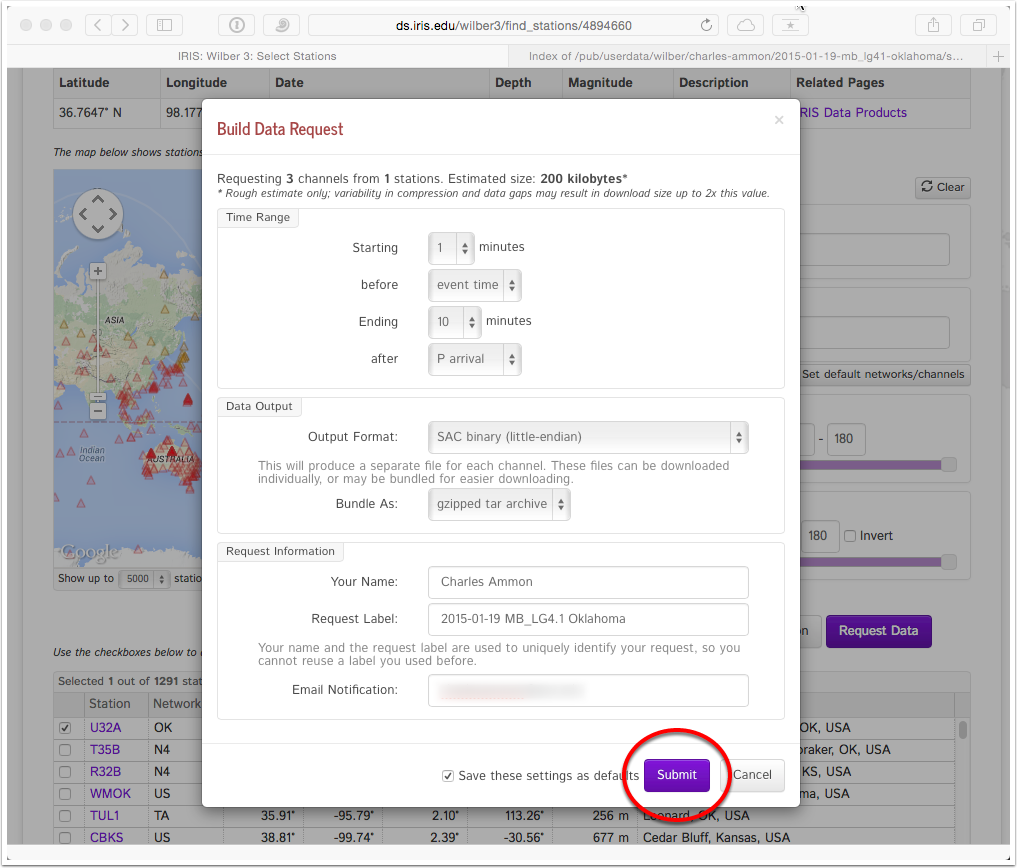
After clicking on the Request-Data button we are presented with a dialog box that allows us to choose the time window and the format of the data. I completed my choices in the example below.
For small requests you can click the button to track the progress.
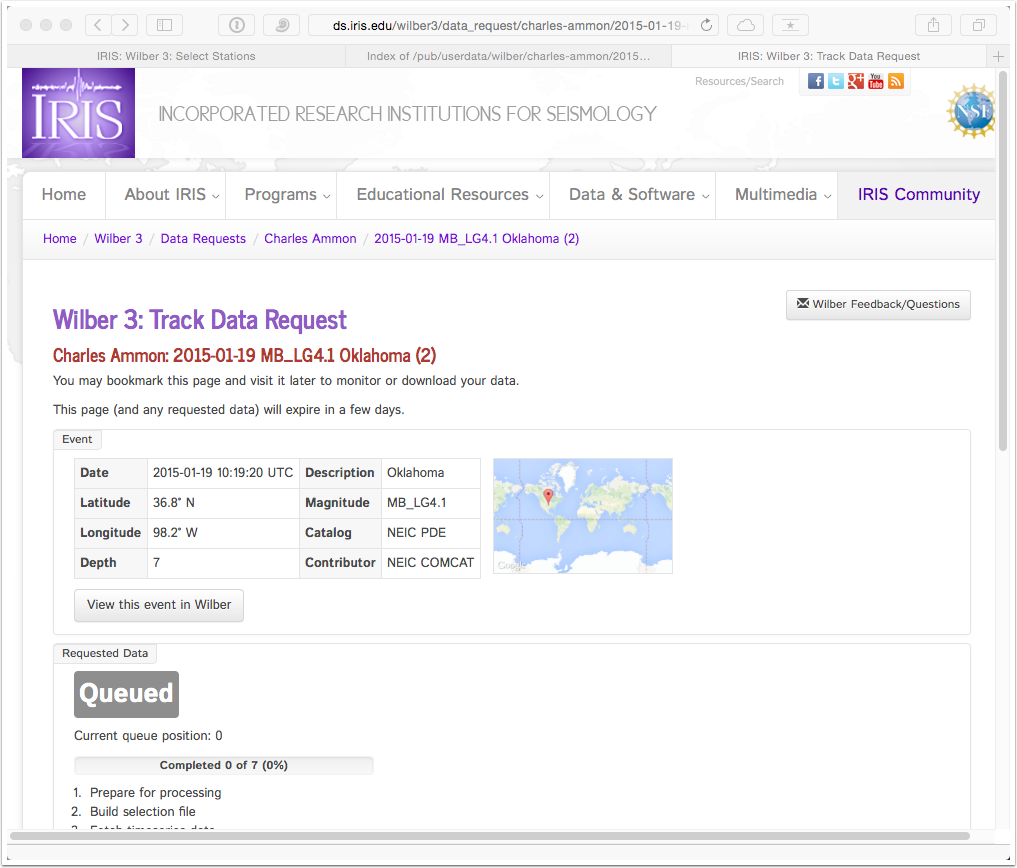
This is a very small request and took about 10 seconds to complete. You also receive emails from Wilber regarding the request.
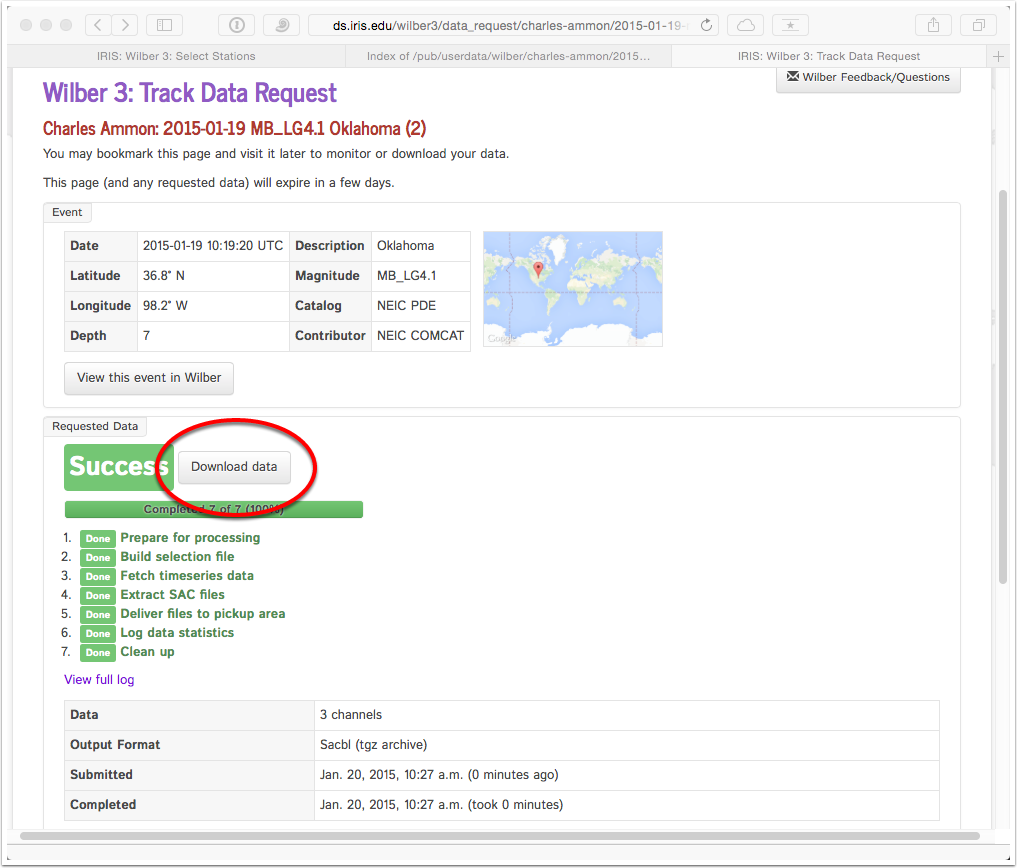
Next you download the data. Since I chose to have the data in an archive and compressed, the browser downloads the file like any other web download. I moved the data into a temporary folder and then uncompressed the package.
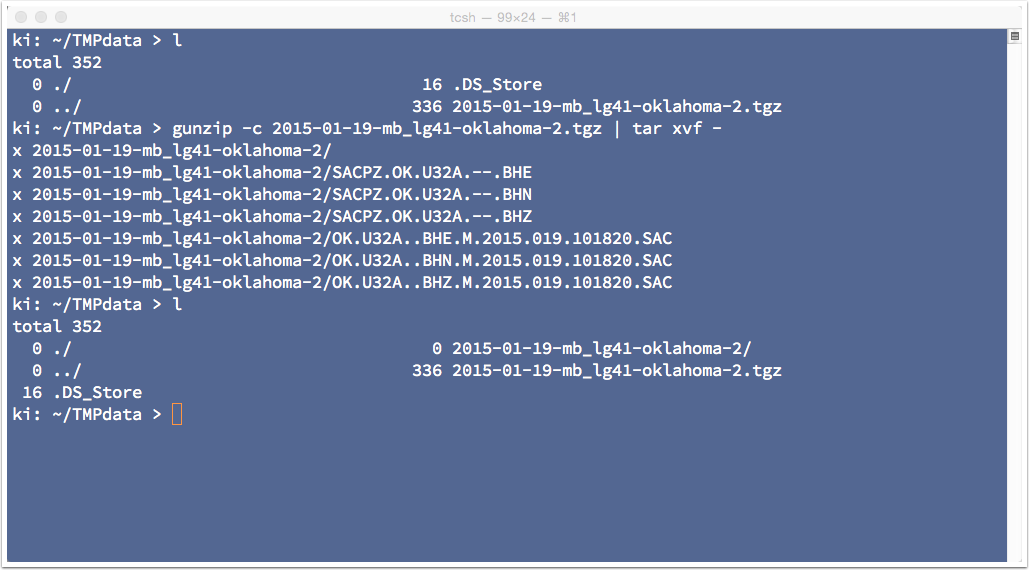
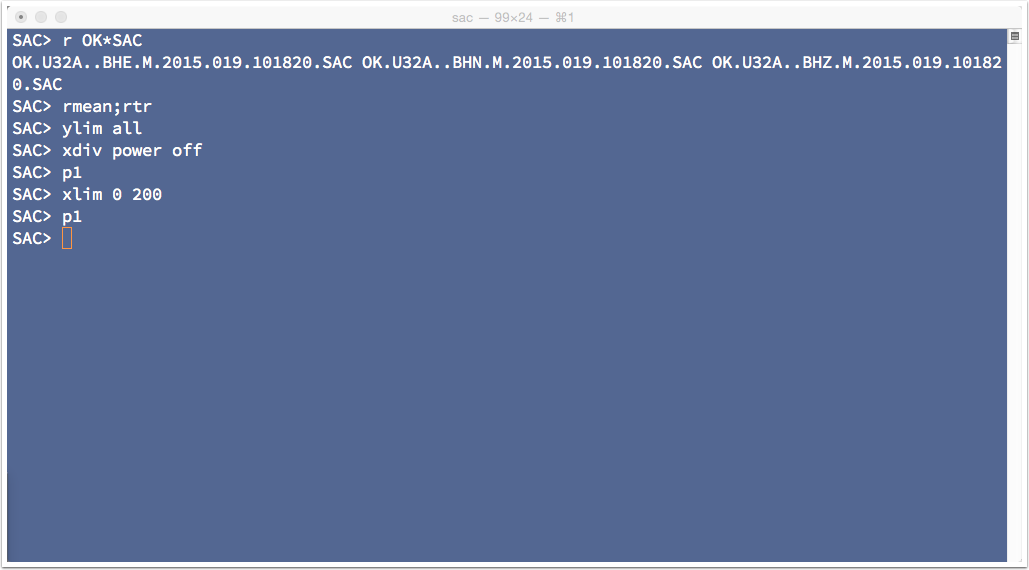
The data subfolder includes three SAC files and three SAC Pole-Zero files that contain information on the seismic-recording system response. You can start SAC and load the data.
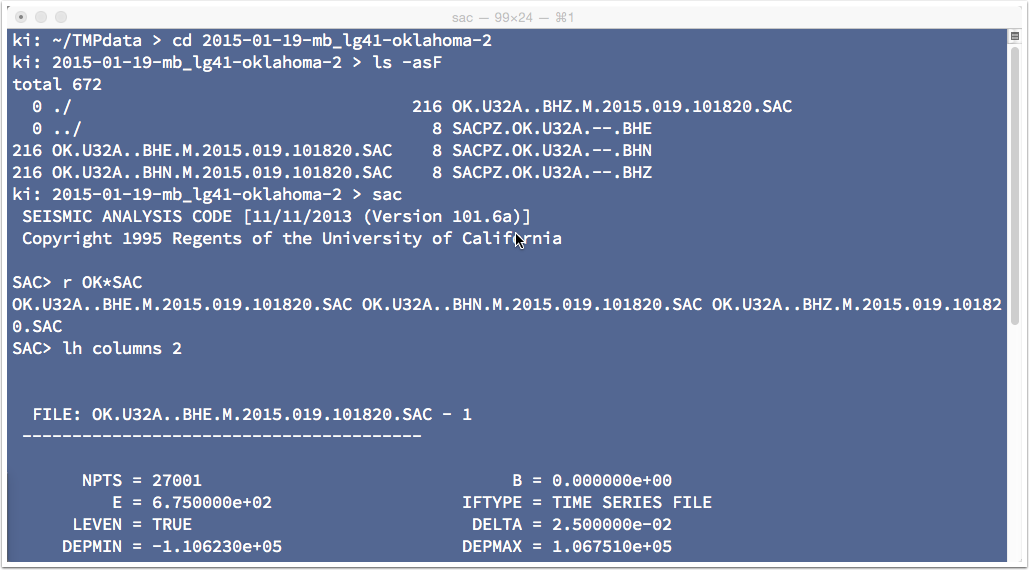
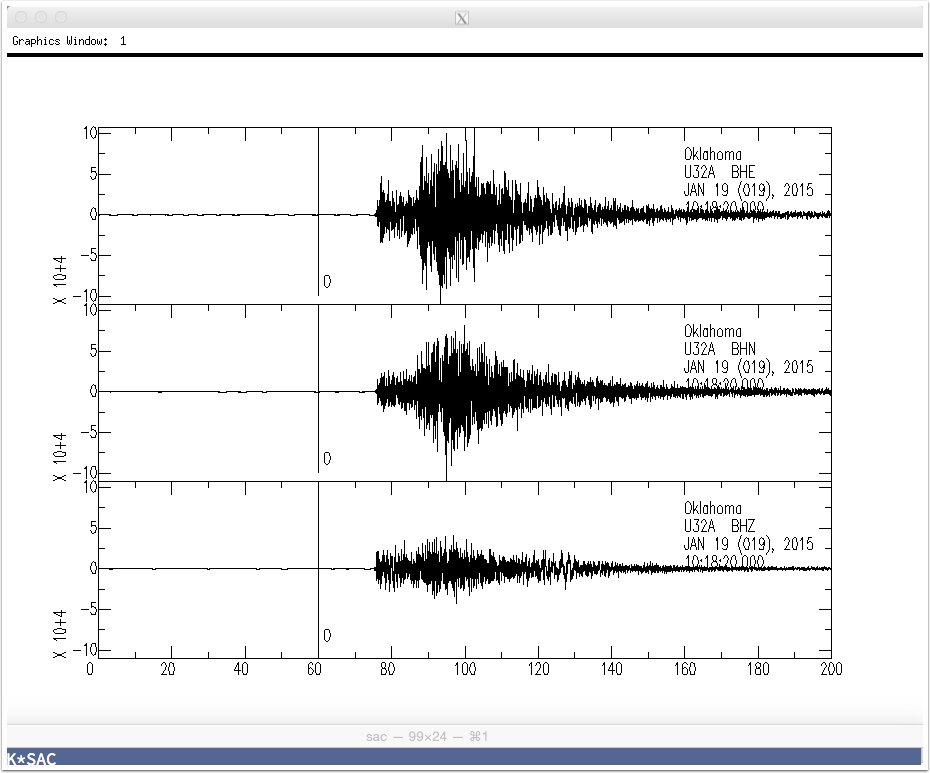
Display them, and zoom in to the time window with the mainshock signals.
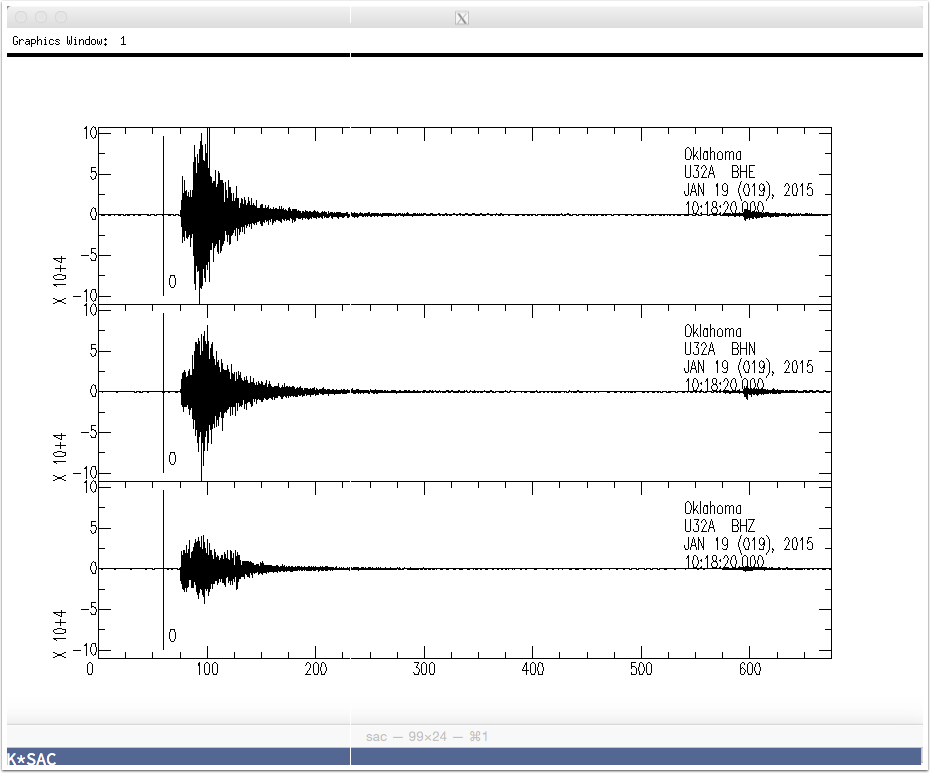
Here are the commands that I used for the display below.
Explore
That's a very simple way to gather data from a known seismic event. Try to get a larger suite of waveforms from an earthquake that interests you, then examine the data with SAC for practice.