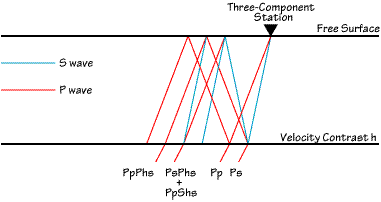
The corresponding ray paths look like this:
|
Receiver-Function Analysis |
| Receiver functions are time series, computed from three-component seismograms, which show the relative response of Earth structure near the receiver. The waveform is a composite of P-to-S converted waves that reverberate in the structure beneath the seismometer. |
|
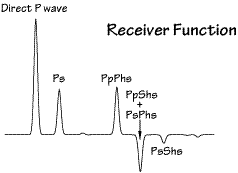
| Modeling the amplitude and timing of those reverberating waves can supply valuable constraints on the underlying geology. Often, the main features of the structure can be approximated by a sequence of nearly-horizontal layers. In that case, the arrivals generated by each sharp (that is, sharp relative to the shortest wavelength in the observations) looks something like the cartoon on the right.
The corresponding ray paths look like this: |
|
|
|
| The amplitudes of the arrivals in a receiver function depend on the incidence angle of the impinging P-wave and the size of the velocity contrasts generating the conversions (Ps) and multiples (PsPhs, PpShs, PpPhs) . The arrival times of the converted phase and multiples depend on the depth of the velocity contrast, the P and S velocity between the contrast and the surface, and the P-wave incidence angle, or ray parameter. The relative amplitudes of the later arrivals and their frequency content depend on the nature of the velocity transition - e.g. is it abroad or relatively sharp velocity change? |
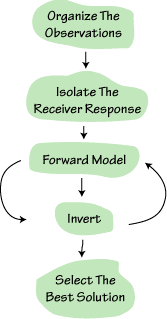
| With that brief description behind us, we can look at the typical "flow" of a receiver-function analysis. The chart to the right shows the main steps in the procedure.
Organizing the observations is important to facilitate study of the variation in the response with incident-wave azimuth (a function of source back azimuth) and the incident-wave angle (a function of source distance and depth). You need three component observations to equalize near-source effects and isolate the receiver effects from the observed waveforms. Isolating the local response requires deconvolution, which generally works best with high-quality broad-band signals. |
 |
|
To forward model the observations, you need to be able to compute receiver functions for various earth models. Formal inversion of the observations for well-fitting one-dimensional velocity structures is relatively easy. Figuring out the importance of various features in the resulting velocity model can be tough, and benefits from a step back to forward modeling to verify the significance (to fitting the waveform) of specific velocity features. The best solution may not be one simple velocity structure. The more a priori information available from other studies and geologic constraints that you can muster, the better your chance for a fruitful study. |
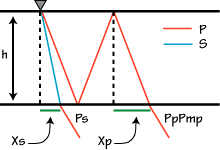 |
The distance from the receiver sampled by a receiver function depends on how far back you look into the signal and how deep the velocity contrast of interest lies. The cartoon below shows the geometry of ray paths for an upper layer with a P-velocity of 6.00 km/sec and S-velocity of 3.43 km/s. |
| Only two ray paths are shown, that for the P-to-S conversion Ps, and for the P-multiple PpPmp (assuming that the contrast at the bottom is the Moho). This multiple is not normally used in receiver function analyses but provides a useful bound on the lateral sampling of the structure.
The important distances are Xs and Xp. The Ps phase samples very close to the station, the multiple averages the structure over a distance slightly less than 3 Xp. From Snell's Law: Xs = h * tan(asin(p*Vs)) Xp = h * tan(asin(p*Vp)) where h is the layer thickness, p is the ray parameter, and Vp and Vs are the P and S-velocity, respectively. If we assume a ray parameter of 0.06 s/km (P-wave from a shallow source about 60° away) and a thickness of 30 km, Xs = 6 km and Xp = 12 km. A good rule of thumb for estimating the lateral sampling is to use approximately 3 times the depth to the deepest interface. Because of its close sampling beneath the seismometer, studying the Ps can provide good lateral resolution of the crust mantle transition using events from different azimuths. |
|
| These notes are a brief guide to using the computer programs that are available for basic receiver-function analysis. The programs use SAC file format, so much of the notes, particularly the preparation of the observations is easily done using SAC and SAC macros. Most of these codes were written by Tom Owens, George Randall, George Zandt, and myself. As you browse through the codes, you will see routines and functions that have an even longer history).
Here's an outline of this little receiver-function web (computer program names are in red):
The links at the bottom of this page (and subsequent pages) can be used to steer through this site. Send me a note if you find these pages useful or if you find errors. I can't invest much energy in this site, but will try to fix glaring mistakes or muddled explanations. |
|
|
|
Overview | Data Prep | Source Equalization | Creating a Model Computing the Response | Inverting a Waveform | References Back to Ammon's Home Prepared: June/July 1997 - Charles J. Ammon, Penn State |